Fig. 7
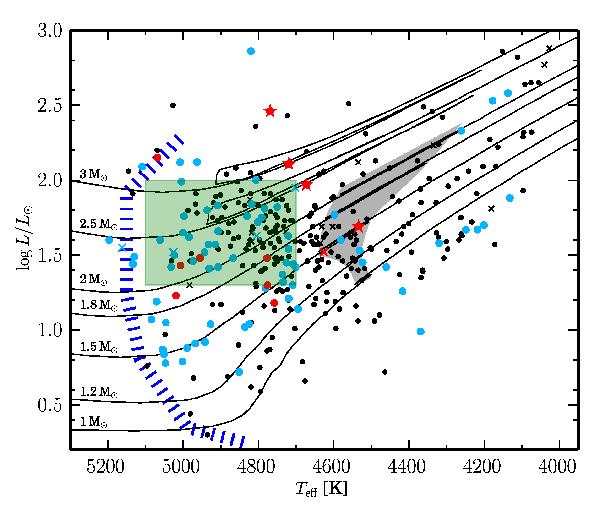
HR diagram showing the location of all the PTPS stars studied in this paper. Colors of points denote Li abundance. Red are the most Li-rich objects (the red stars denote the four most Li-rich giants). Stars denoted in blue have moderate Li level, and black is for Li-poor stars. Crosses denote stars with uncertain atmospheric parameters. The blue stripes denote the beginning of RGB. The gray area is LFB region, and green box denotes RGC. Evolutionary tracks from Bertelli et al. (2008) for 1 − 3 M⊙ stars with solar metallicity are plotted as solid lines.
Current usage metrics show cumulative count of Article Views (full-text article views including HTML views, PDF and ePub downloads, according to the available data) and Abstracts Views on Vision4Press platform.
Data correspond to usage on the plateform after 2015. The current usage metrics is available 48-96 hours after online publication and is updated daily on week days.
Initial download of the metrics may take a while.