Fig. 4
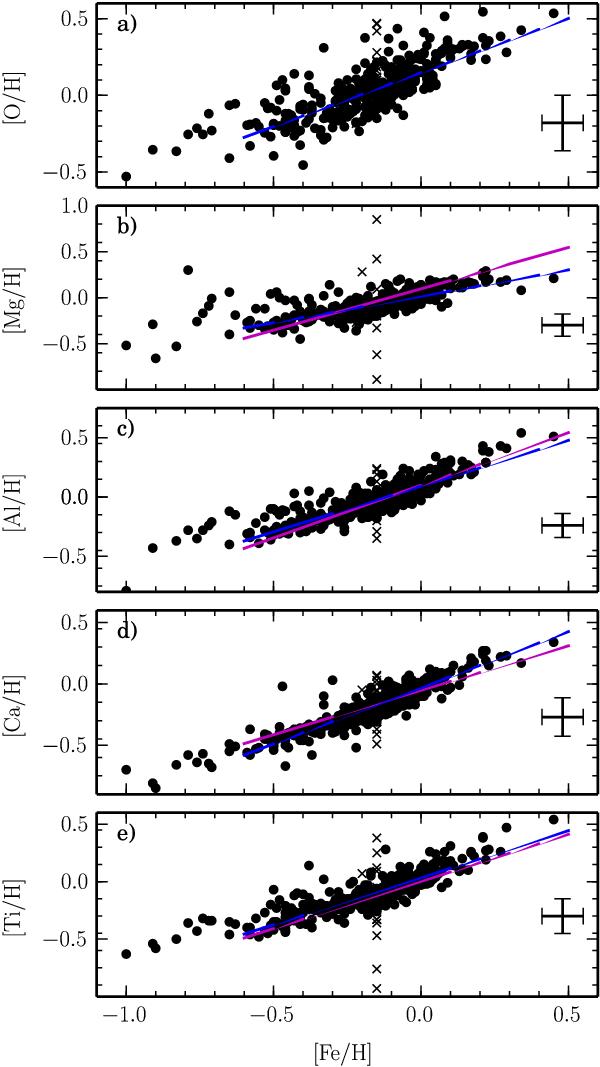
Abundances for the complete sample of giants (crosses denote stars with uncertain atmospheric parameters). The error bars in the lower right corners are the mean uncertainties for [Fe/H], as adopted from Zieliński et al. (2012) and for abundances of a given element obtained in this work. Blue lines represent linear regression fits with coefficients presented in Table 4, while magenta lines are fits of Luck & Heiter (2007).
Current usage metrics show cumulative count of Article Views (full-text article views including HTML views, PDF and ePub downloads, according to the available data) and Abstracts Views on Vision4Press platform.
Data correspond to usage on the plateform after 2015. The current usage metrics is available 48-96 hours after online publication and is updated daily on week days.
Initial download of the metrics may take a while.