Fig. 9
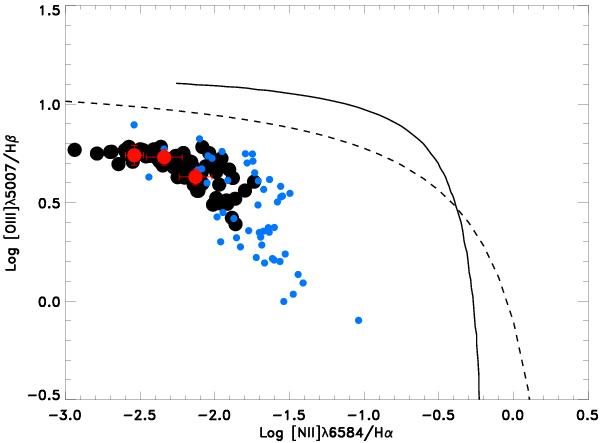
log [O iii]λ5007/Hβ versus log [N ii]λ6584/Hα BPT diagram. The solid curves show the empirical borders between photoionization by massive stars and other excitation mechanisms (Osterbrock & Ferland 2006), while the dotted lines show the demarcation proposed by Kewley et al. (2001). Black dots correspond to individual spaxels in Fig. 8. The values for region 1−3 of HS 2236+1344 are indicated in the diagram by red points. Blue data points show several low metallicity (12 + log(O/H) ≲ 7.6) SF regions from Izotov et al. (2012).
Current usage metrics show cumulative count of Article Views (full-text article views including HTML views, PDF and ePub downloads, according to the available data) and Abstracts Views on Vision4Press platform.
Data correspond to usage on the plateform after 2015. The current usage metrics is available 48-96 hours after online publication and is updated daily on week days.
Initial download of the metrics may take a while.