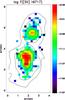
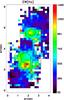
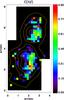
Fig. 3
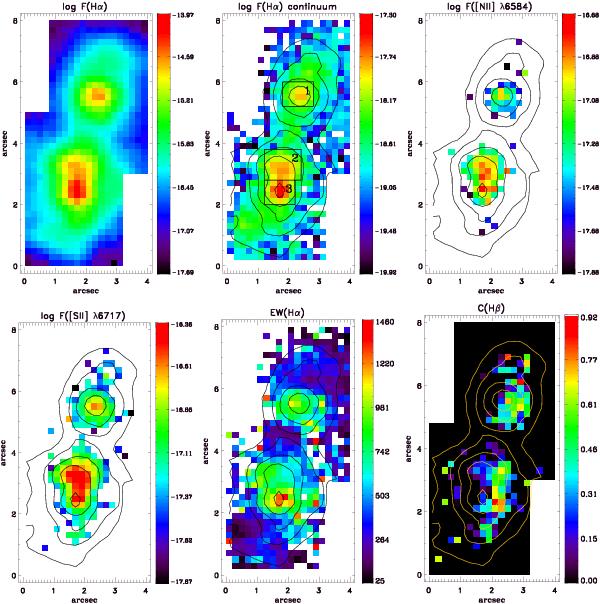
Logarithmic emission line map of the Hα (top-left), Hα continuum (top-middle), [N ii] λ6584 (top-right), [S ii] λ6717 (bottom-left), EW(Hα) (bottom-middle) and extinction c(Hβ) (bottom-right). Logarithmic emission-line fluxes in units of erg cm-2 s-1, the logarithmic continuum flux density is in erg cm-2 s-1Å-1 and equivalent widths in Å. Overlaid are the Hα flux contours. In the top-middle (Hα continuum) panel we indicate the different apertures used in this study for regions 1−3, respectively.
Current usage metrics show cumulative count of Article Views (full-text article views including HTML views, PDF and ePub downloads, according to the available data) and Abstracts Views on Vision4Press platform.
Data correspond to usage on the plateform after 2015. The current usage metrics is available 48-96 hours after online publication and is updated daily on week days.
Initial download of the metrics may take a while.