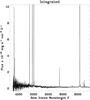
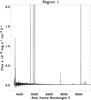
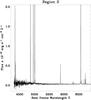
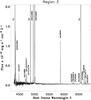
Fig. 2
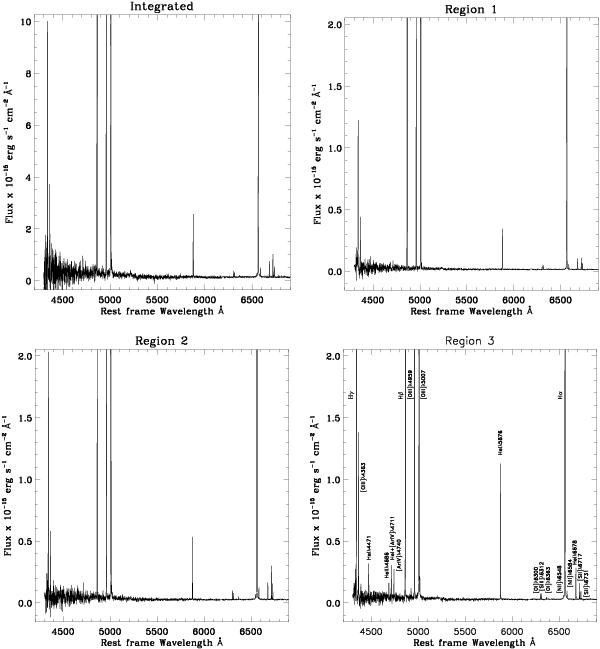
Integrated Gemini GMOS spectrum of HS 2236+1344, and spectra extracted from regions 1–3 over the rest frame spectral range from ~4300 Å to 6900 Å. Note the presence of a broad low-intensity emission component in Hα (possibly also in Hβ) and in the forbidden [O iii]λ5007 line.
Current usage metrics show cumulative count of Article Views (full-text article views including HTML views, PDF and ePub downloads, according to the available data) and Abstracts Views on Vision4Press platform.
Data correspond to usage on the plateform after 2015. The current usage metrics is available 48-96 hours after online publication and is updated daily on week days.
Initial download of the metrics may take a while.