Fig. 13
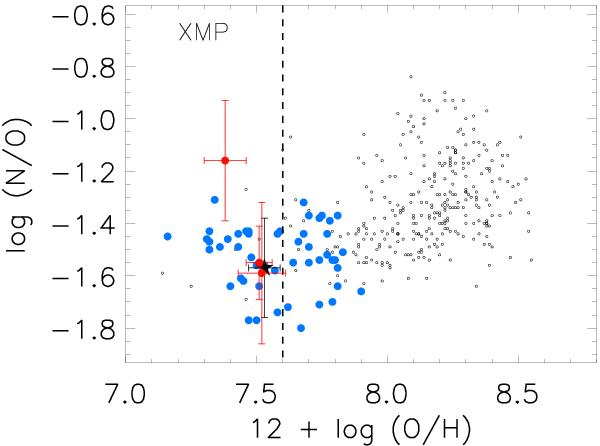
log(N/O) vs. 12 + log(O/H) abundances. The values of the three GH iiRs resolved in HS 2236+1344 are plotted by red points. The black star corresponds with the integrated value of the galaxy. While the small black open dots corresponds with values found by Izotov et al. (2006b) for a large sample of SDSS starburst galaxies and blue dots show data from Izotov et al. (2012) for a sample of XBCDs.
Current usage metrics show cumulative count of Article Views (full-text article views including HTML views, PDF and ePub downloads, according to the available data) and Abstracts Views on Vision4Press platform.
Data correspond to usage on the plateform after 2015. The current usage metrics is available 48-96 hours after online publication and is updated daily on week days.
Initial download of the metrics may take a while.