Fig. 10
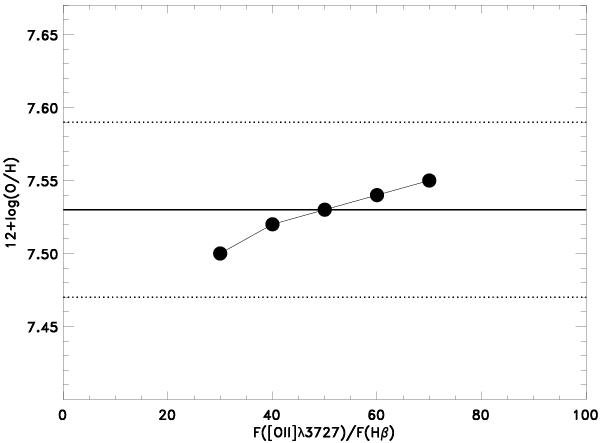
Variation of the 12 + log(O/H) abundance in the integrated galaxy (black data points) as a function of the adopted F([Oii] λ3727)/F(Hβ) ratio. The fluxes are relative to F(Hβ) = 100. The continuum lines corresponds to the integrated values of 7.53 and the dotted lines show the uncertainties associated with these values. More details are in the text.
Current usage metrics show cumulative count of Article Views (full-text article views including HTML views, PDF and ePub downloads, according to the available data) and Abstracts Views on Vision4Press platform.
Data correspond to usage on the plateform after 2015. The current usage metrics is available 48-96 hours after online publication and is updated daily on week days.
Initial download of the metrics may take a while.