Fig. 4
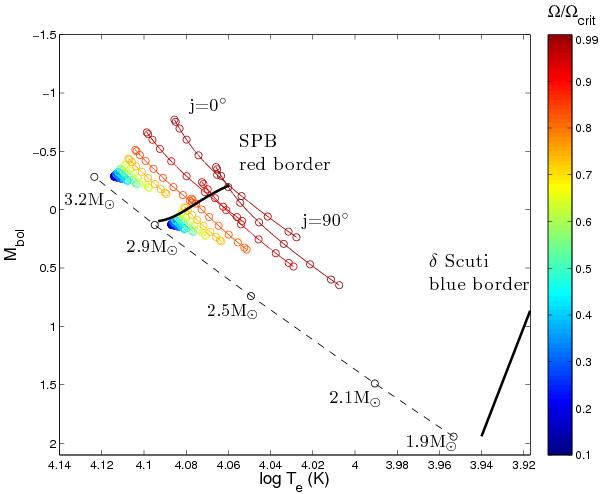
Bolometric magnitude and effective temperature as a function of j, for 2.9 and 3.2 M⊙ Geneva models ~20 Myr old. Their rotation rate is indicated by the colour scale. The j angles from 0° to 90° are shown with help of dots every 10°. The dot-dashed line represents the zero age MS of non-rotating models from 1.9 M⊙ to 3.2 M⊙. Thick black lines show the red and blue borders of the instability strips for non-rotating SPB (this work) and δ Scuti models (Dupret et al. 2005), respectively.
Current usage metrics show cumulative count of Article Views (full-text article views including HTML views, PDF and ePub downloads, according to the available data) and Abstracts Views on Vision4Press platform.
Data correspond to usage on the plateform after 2015. The current usage metrics is available 48-96 hours after online publication and is updated daily on week days.
Initial download of the metrics may take a while.