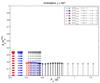
Fig. 3
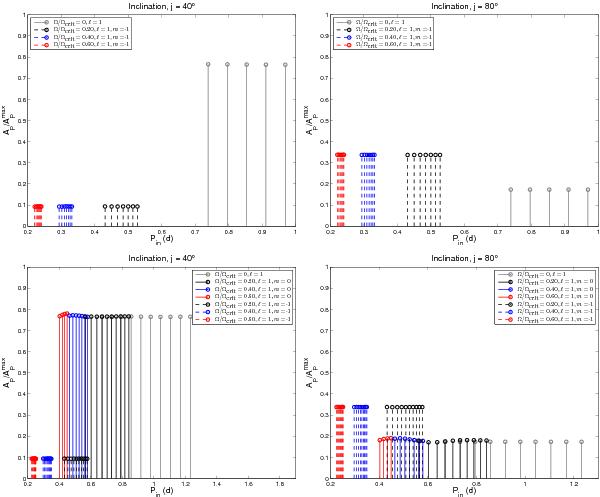
Normalised amplitudes as a function of the inertial periods of all the ℓ1 modes found to be unstable in the 2.9 M⊙ (top) and 3.2 M⊙ (bottom) models aged ~20 Myr. The details of the normalisation are given in the main text. Left (resp. right) panels correspond to an observer viewing angle of 40° (resp. 80°). Grey solid lines show the modes in a case with no rotation. Dashed and solid lines represent the PS and axisymmetric modes, respectively, while black, blue, and red colours refer to a rotation of 0.20, 0.40, and 0.60 Ωcrit, respectively.
Current usage metrics show cumulative count of Article Views (full-text article views including HTML views, PDF and ePub downloads, according to the available data) and Abstracts Views on Vision4Press platform.
Data correspond to usage on the plateform after 2015. The current usage metrics is available 48-96 hours after online publication and is updated daily on week days.
Initial download of the metrics may take a while.