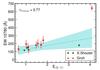
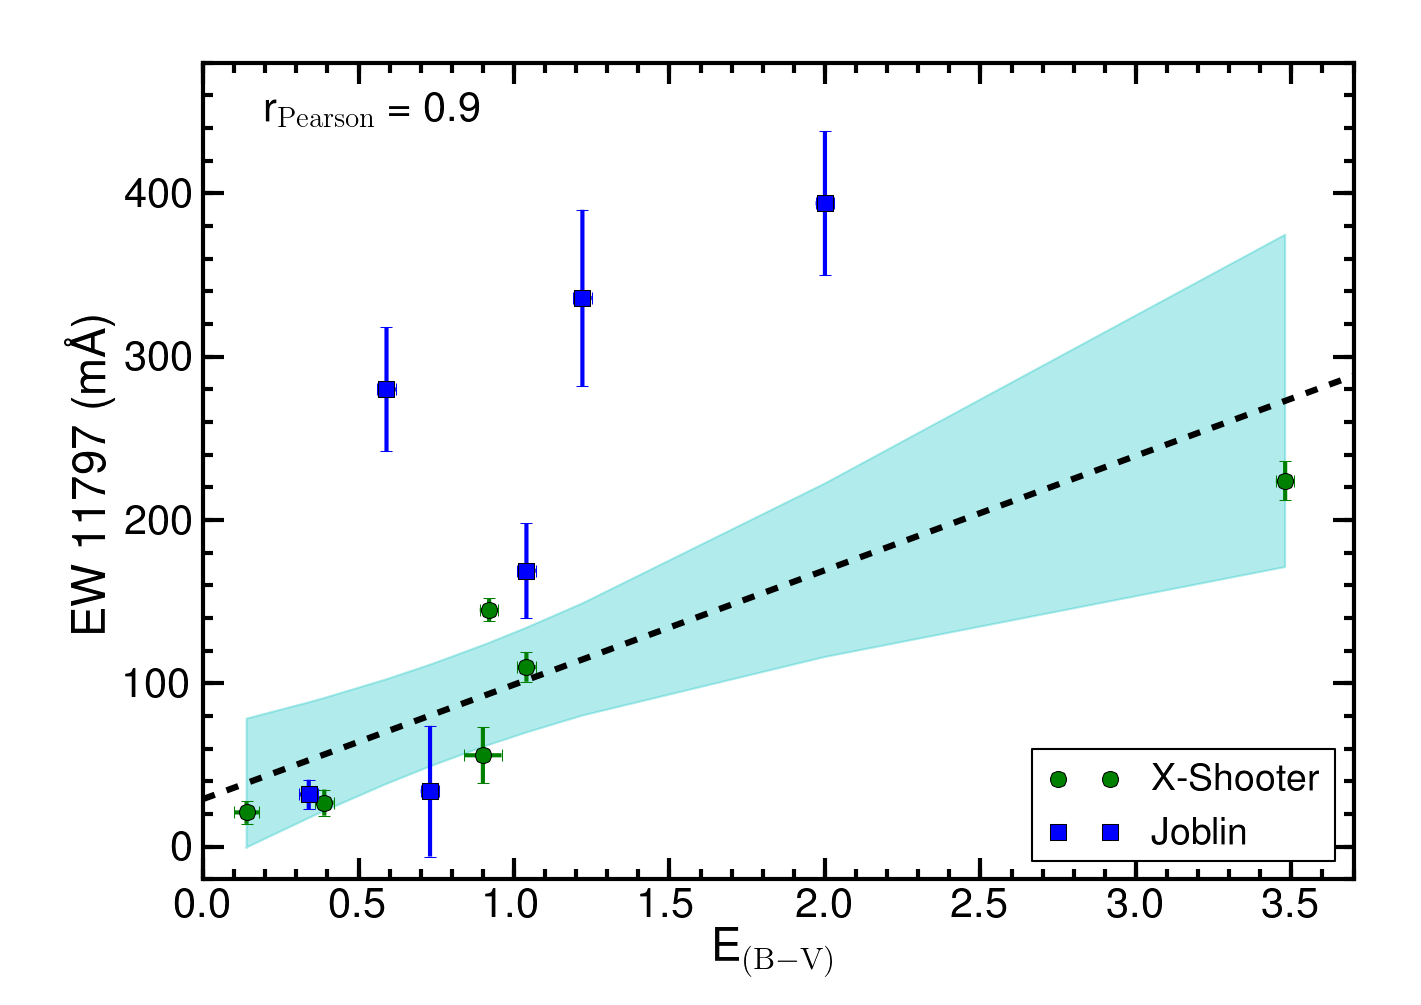
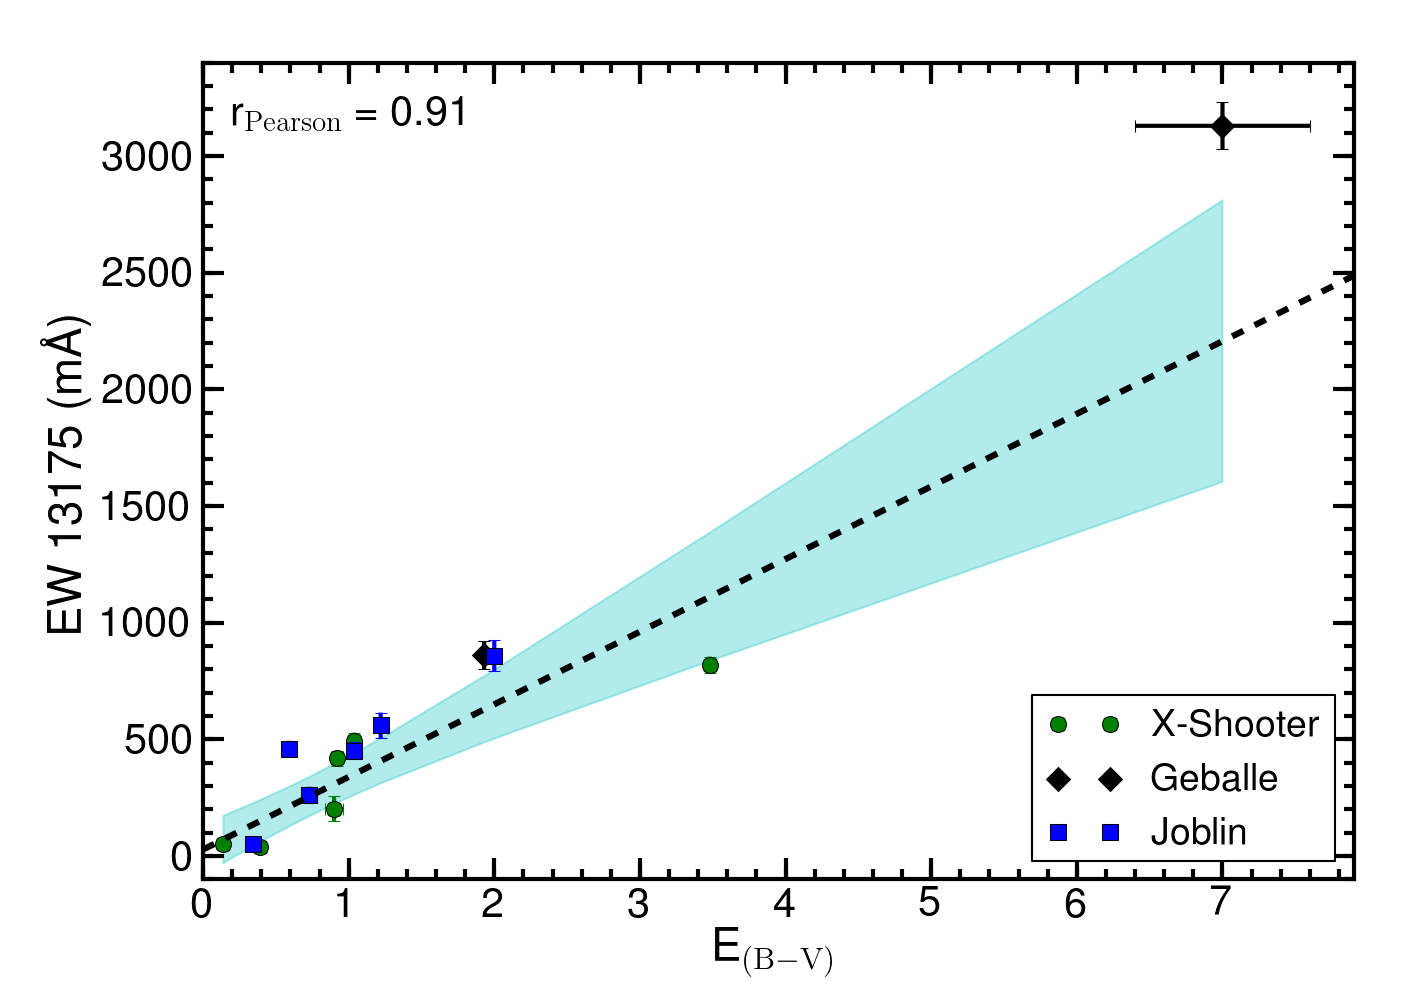
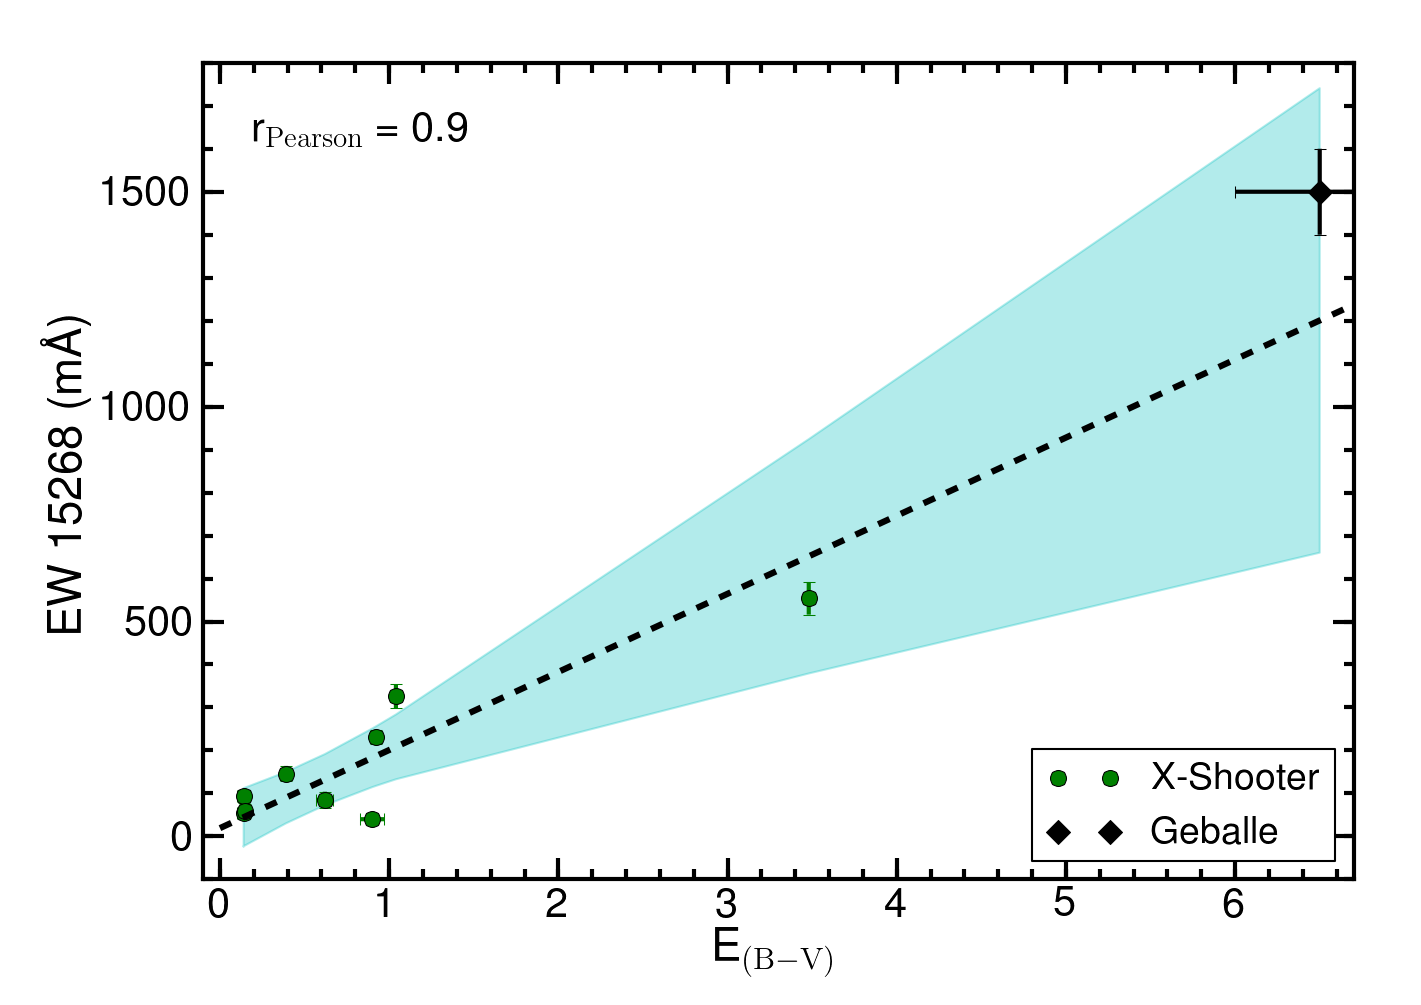
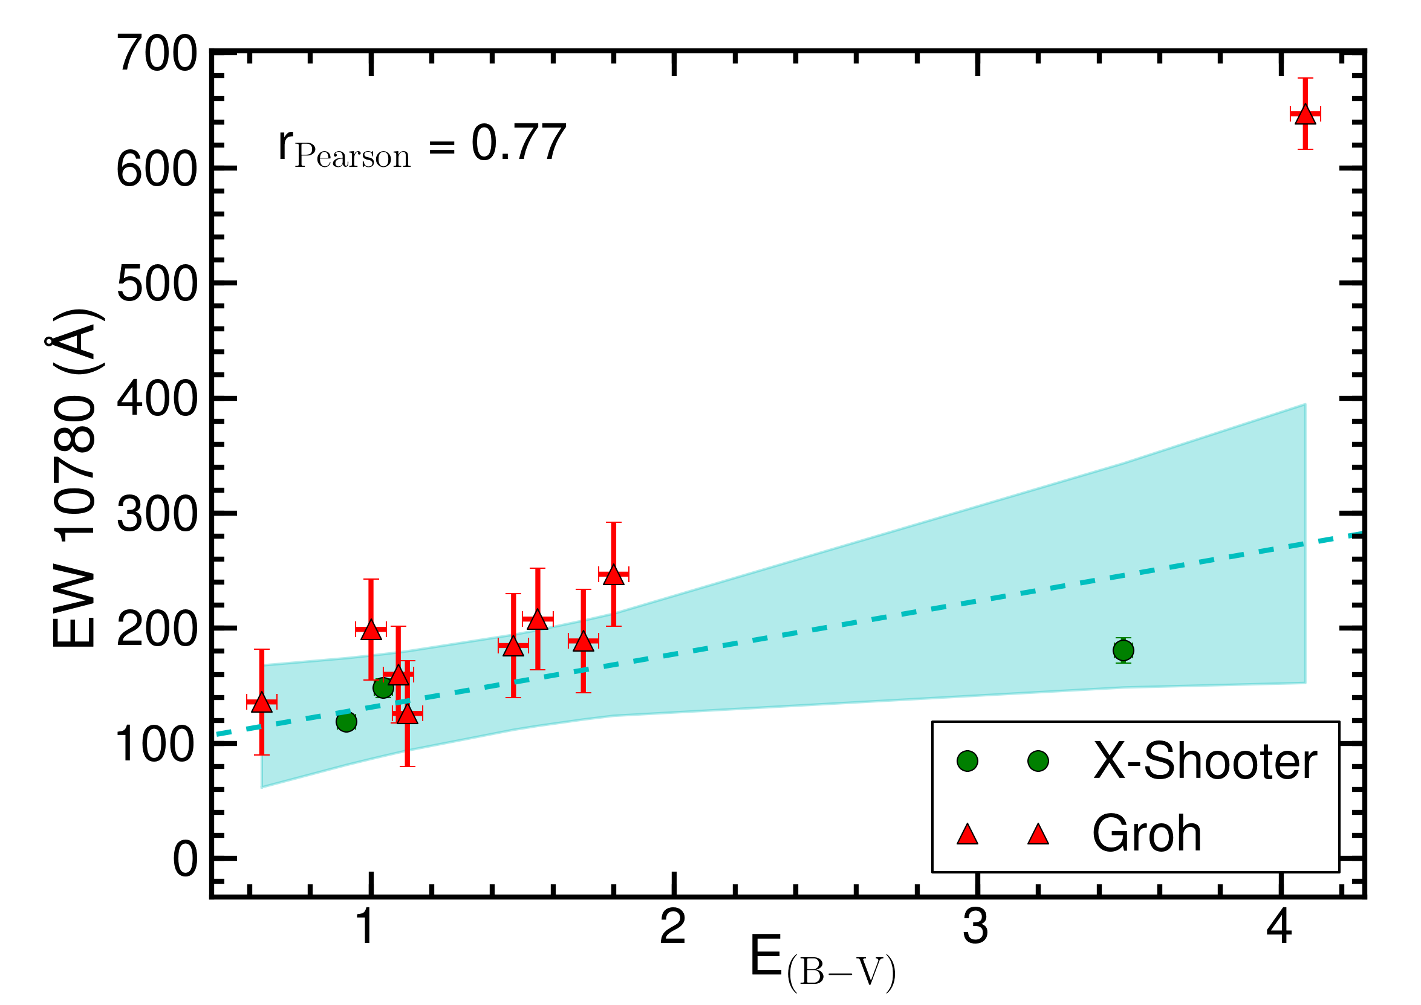
Fig. 8
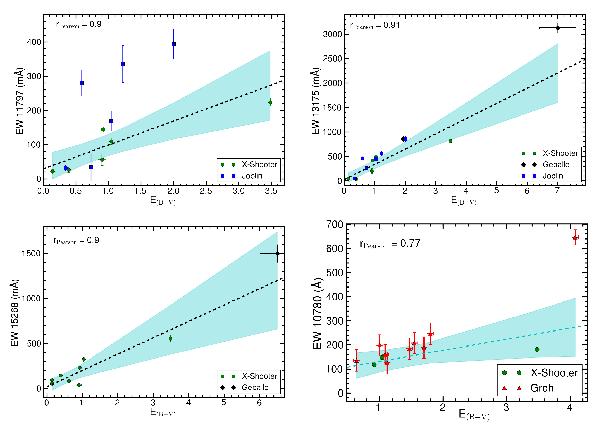
λλ11 797, 13 175, 15 268, and 10 780 NIR DIB equivalent widths (Å) as a function of reddening, E(B − V) including measurements from Joblin et al. (1990, blue squares), Geballe et al. (2011, see also Table 2, Groh et al. (2007, red triangles) and this work (green circles). The linear least-square fit is indicated by the black dashed line (parameters are given in Table 5) and the shaded cyan area indicates the 95% confidence interval.
Current usage metrics show cumulative count of Article Views (full-text article views including HTML views, PDF and ePub downloads, according to the available data) and Abstracts Views on Vision4Press platform.
Data correspond to usage on the plateform after 2015. The current usage metrics is available 48-96 hours after online publication and is updated daily on week days.
Initial download of the metrics may take a while.