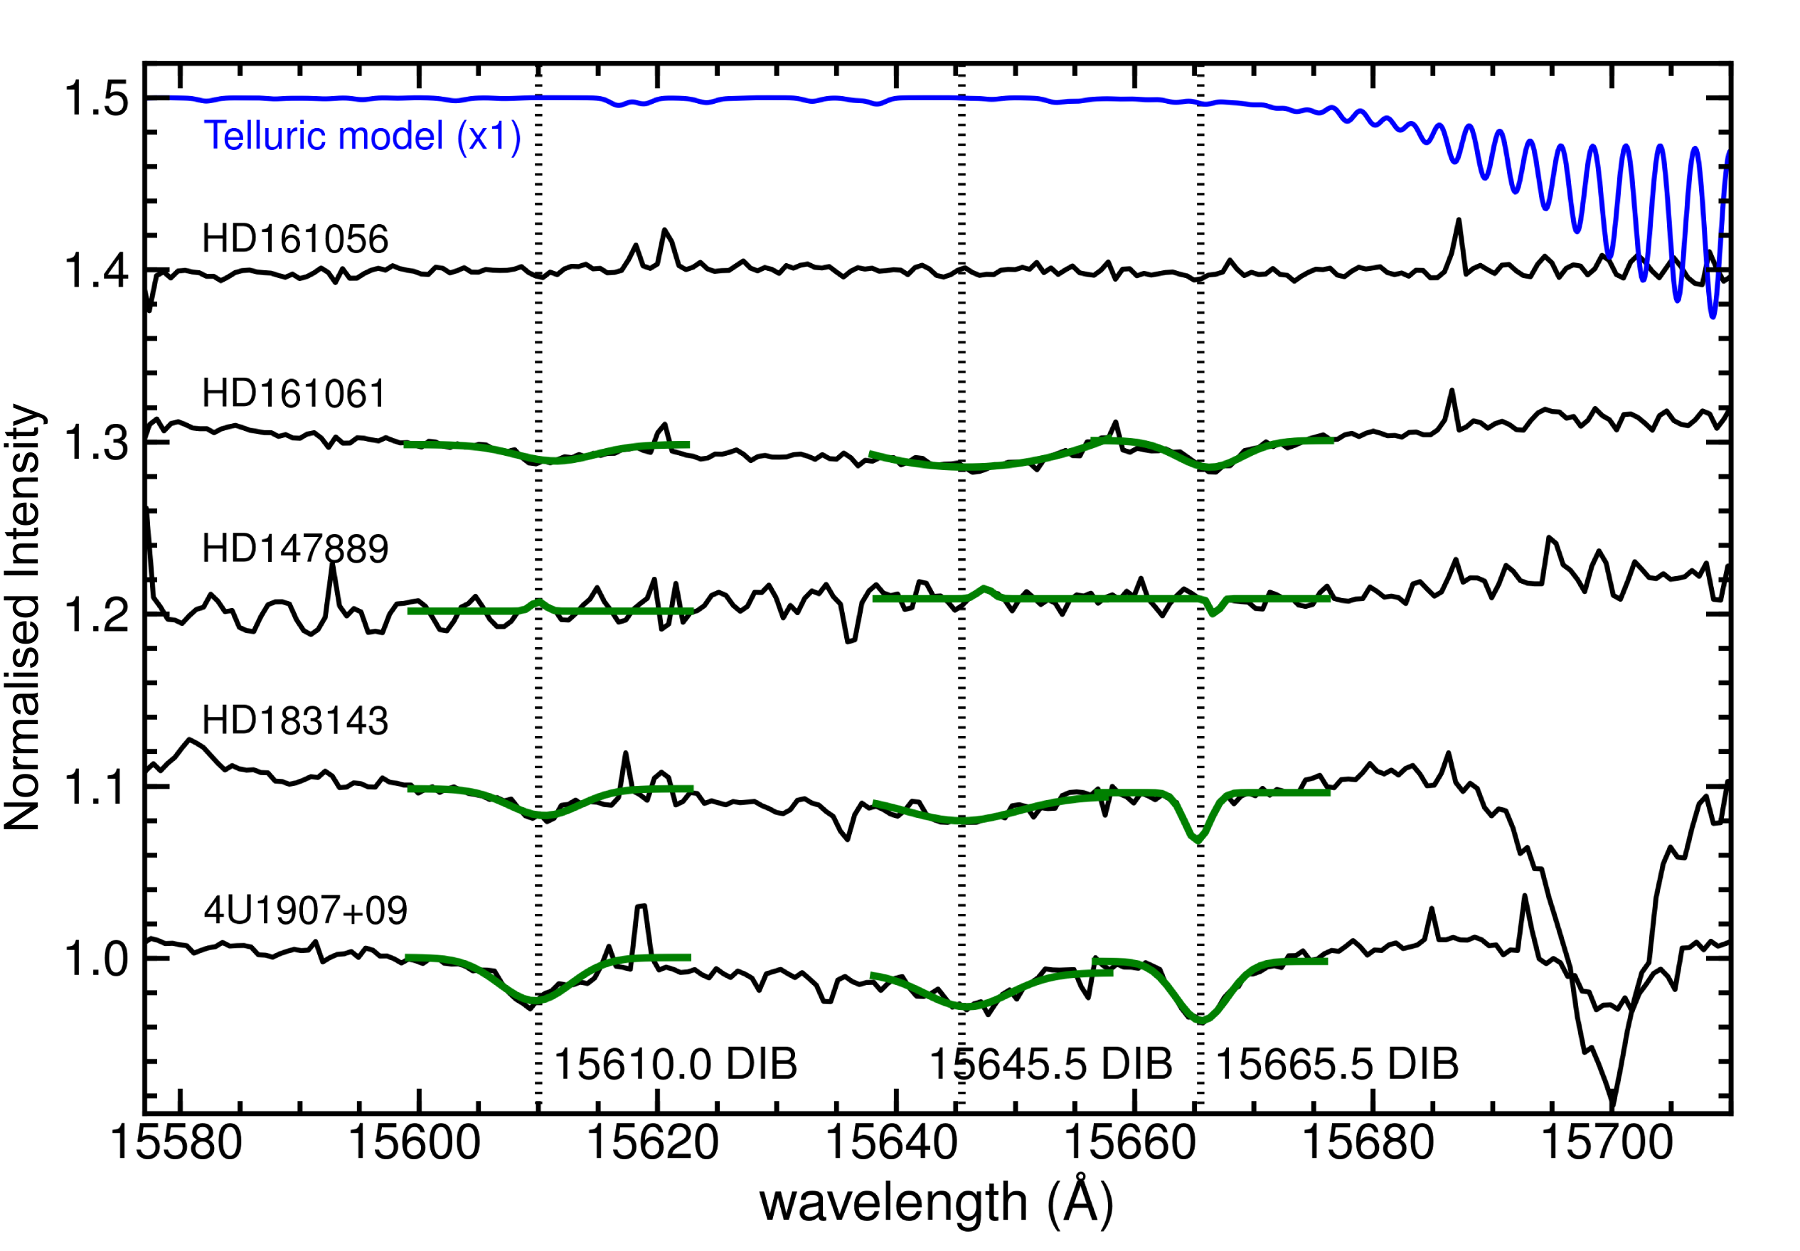
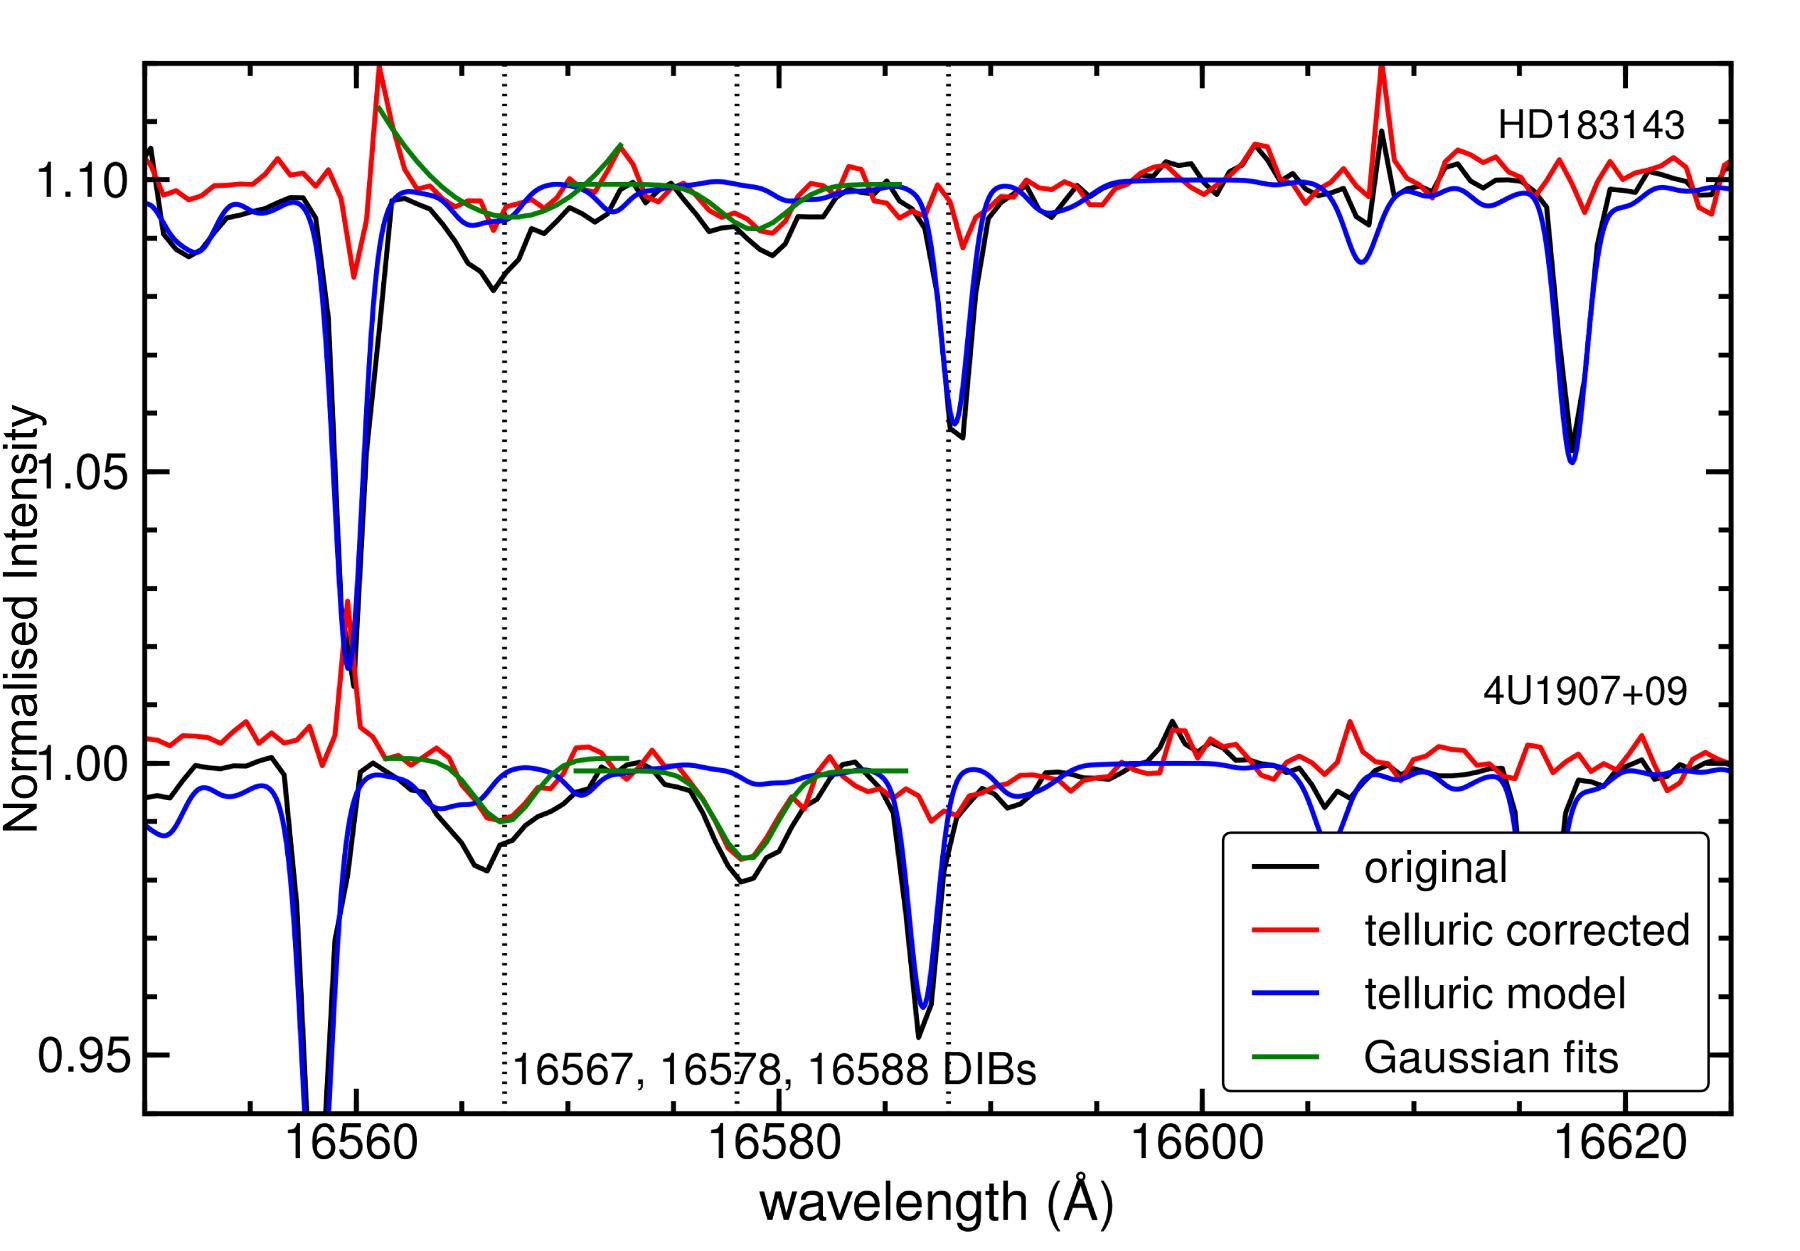
Fig. 5
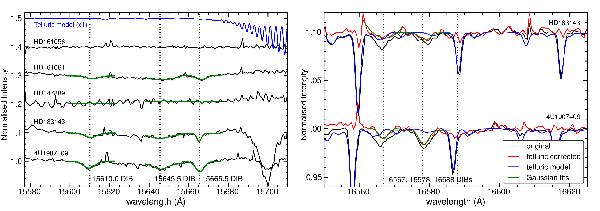
Same as Fig. 4 but for the 15 610, 15 646, and 15 666 Å NIR DIBs towards five reddened targets (left panel) and for the 16 567, 16 578, and 16 588 Å NIR DIBs in two reddened lines of sight (right panel). Solid green curves show the Gaussian model fits and the blue solid curve displays the telluric model spectrum. In the right panel the original (normalised) spectra are shown in black while the telluric corrected spectrum is overplotted in red.
Current usage metrics show cumulative count of Article Views (full-text article views including HTML views, PDF and ePub downloads, according to the available data) and Abstracts Views on Vision4Press platform.
Data correspond to usage on the plateform after 2015. The current usage metrics is available 48-96 hours after online publication and is updated daily on week days.
Initial download of the metrics may take a while.