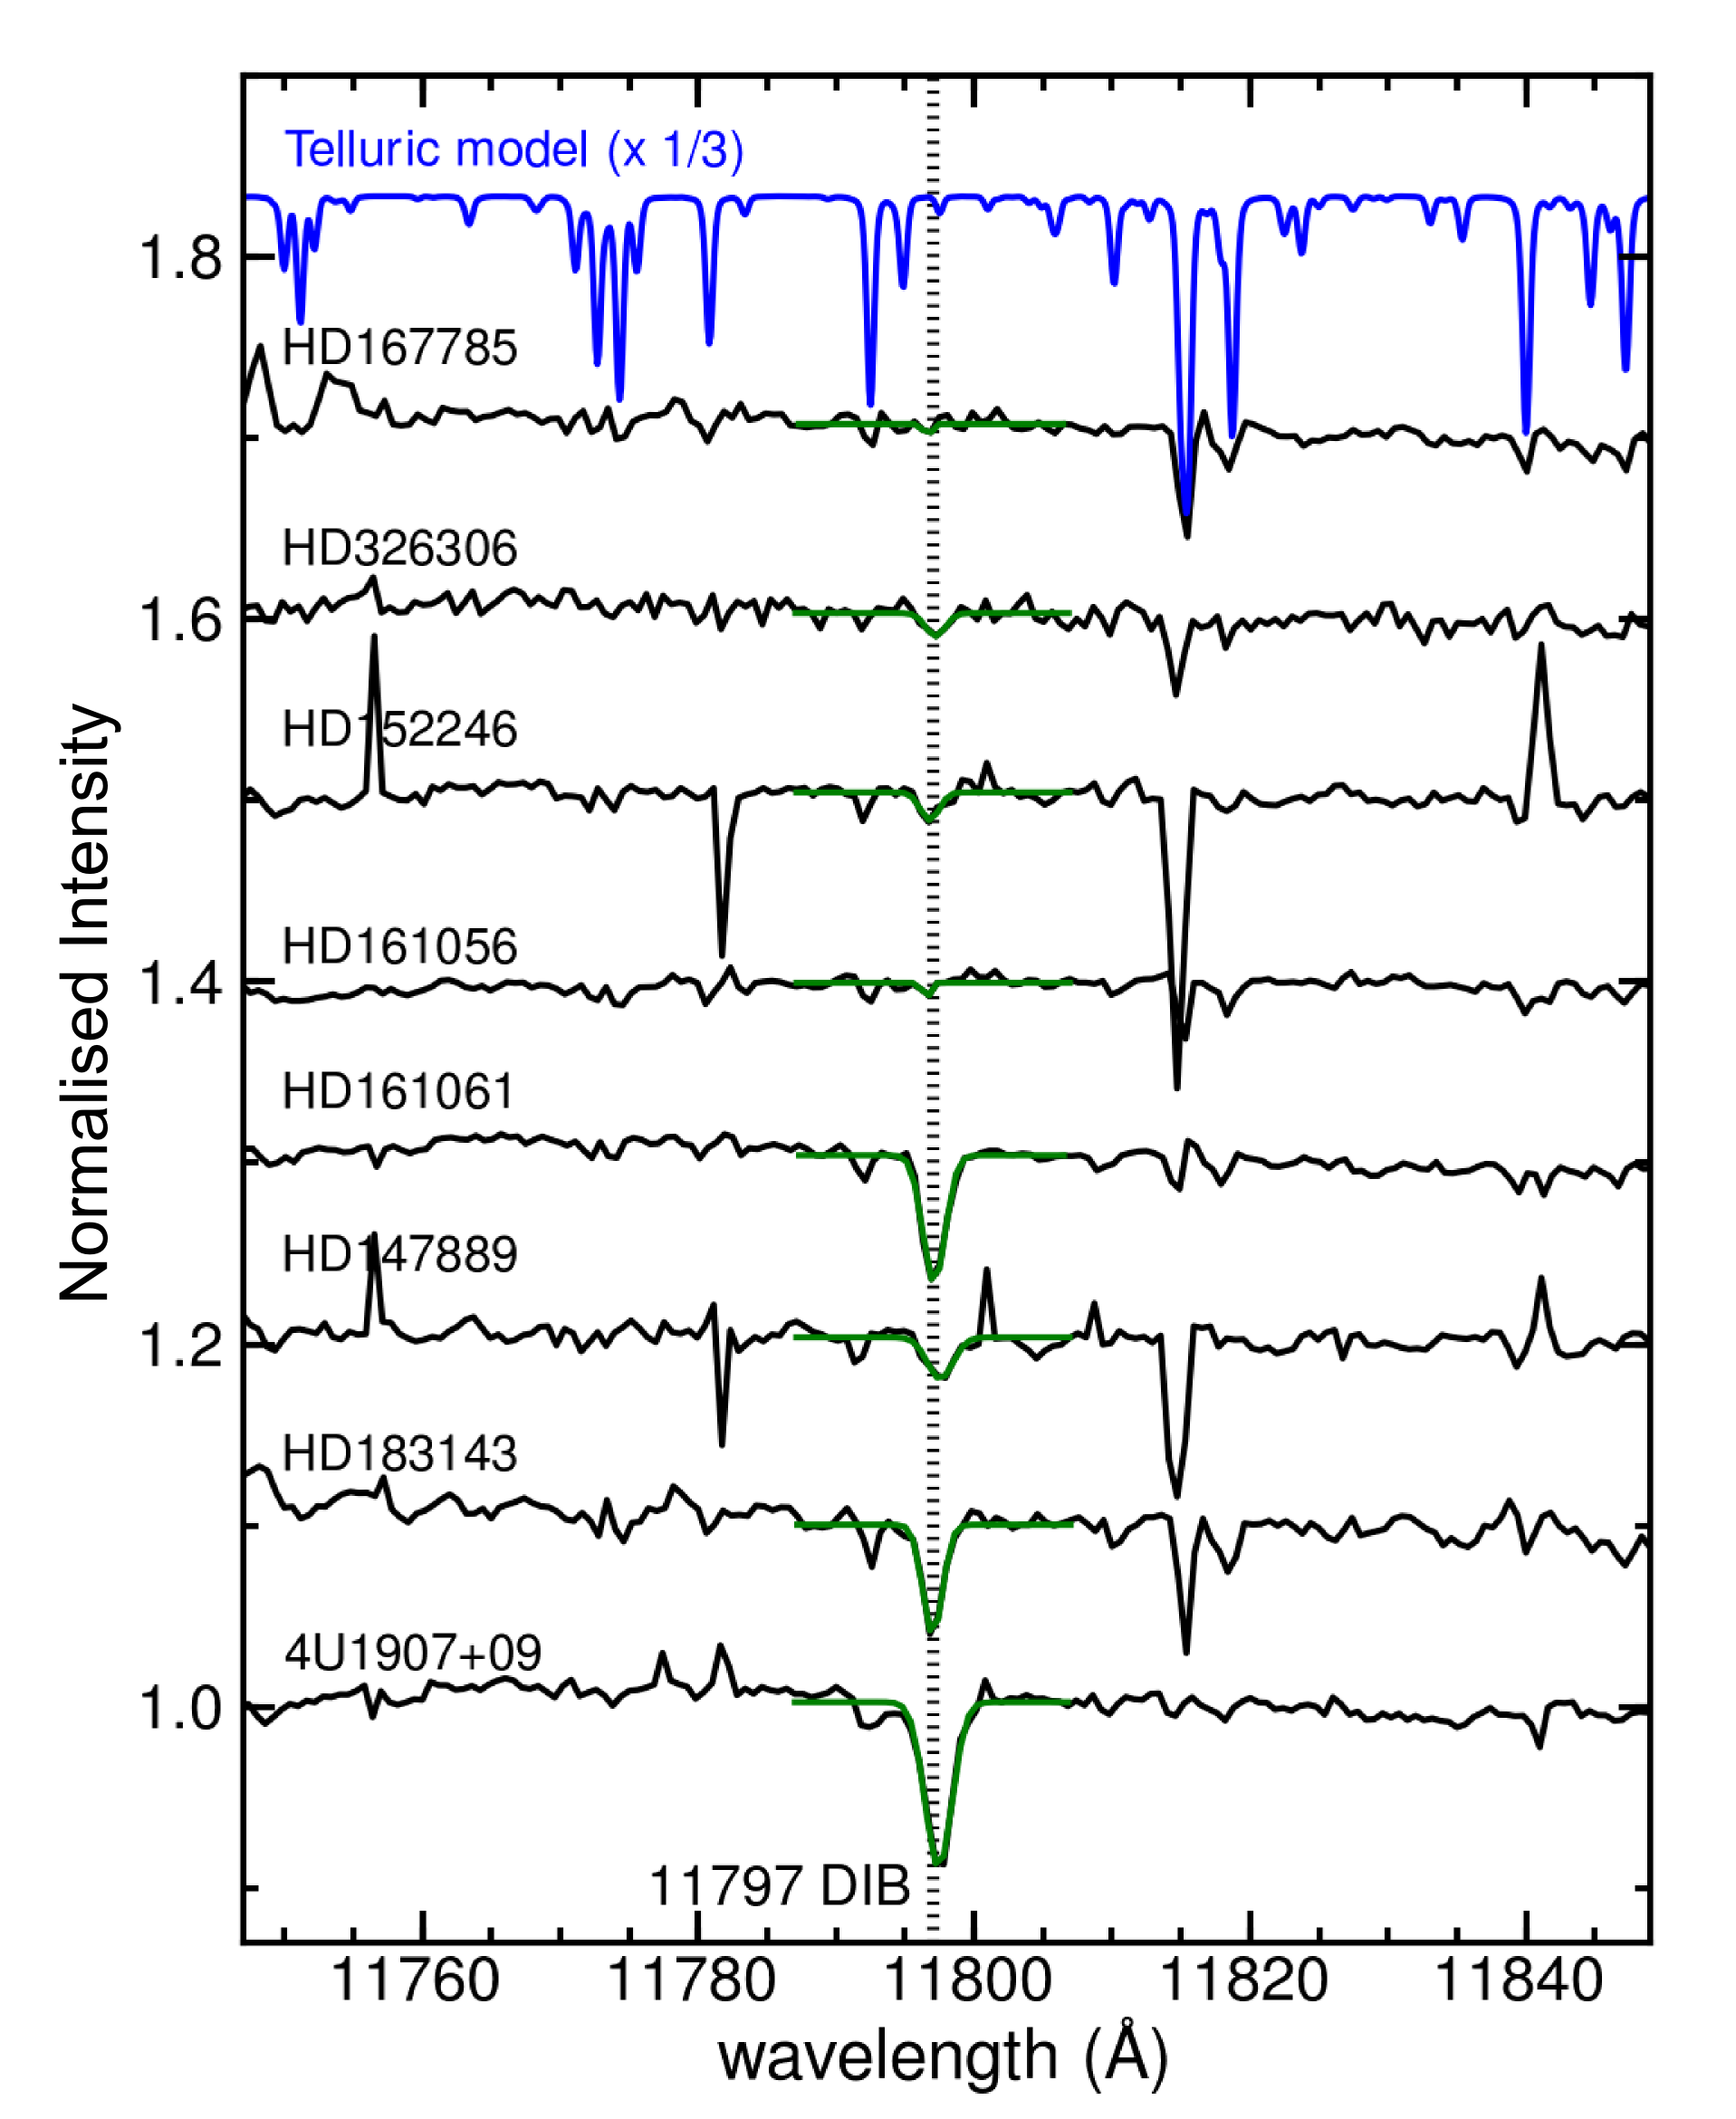
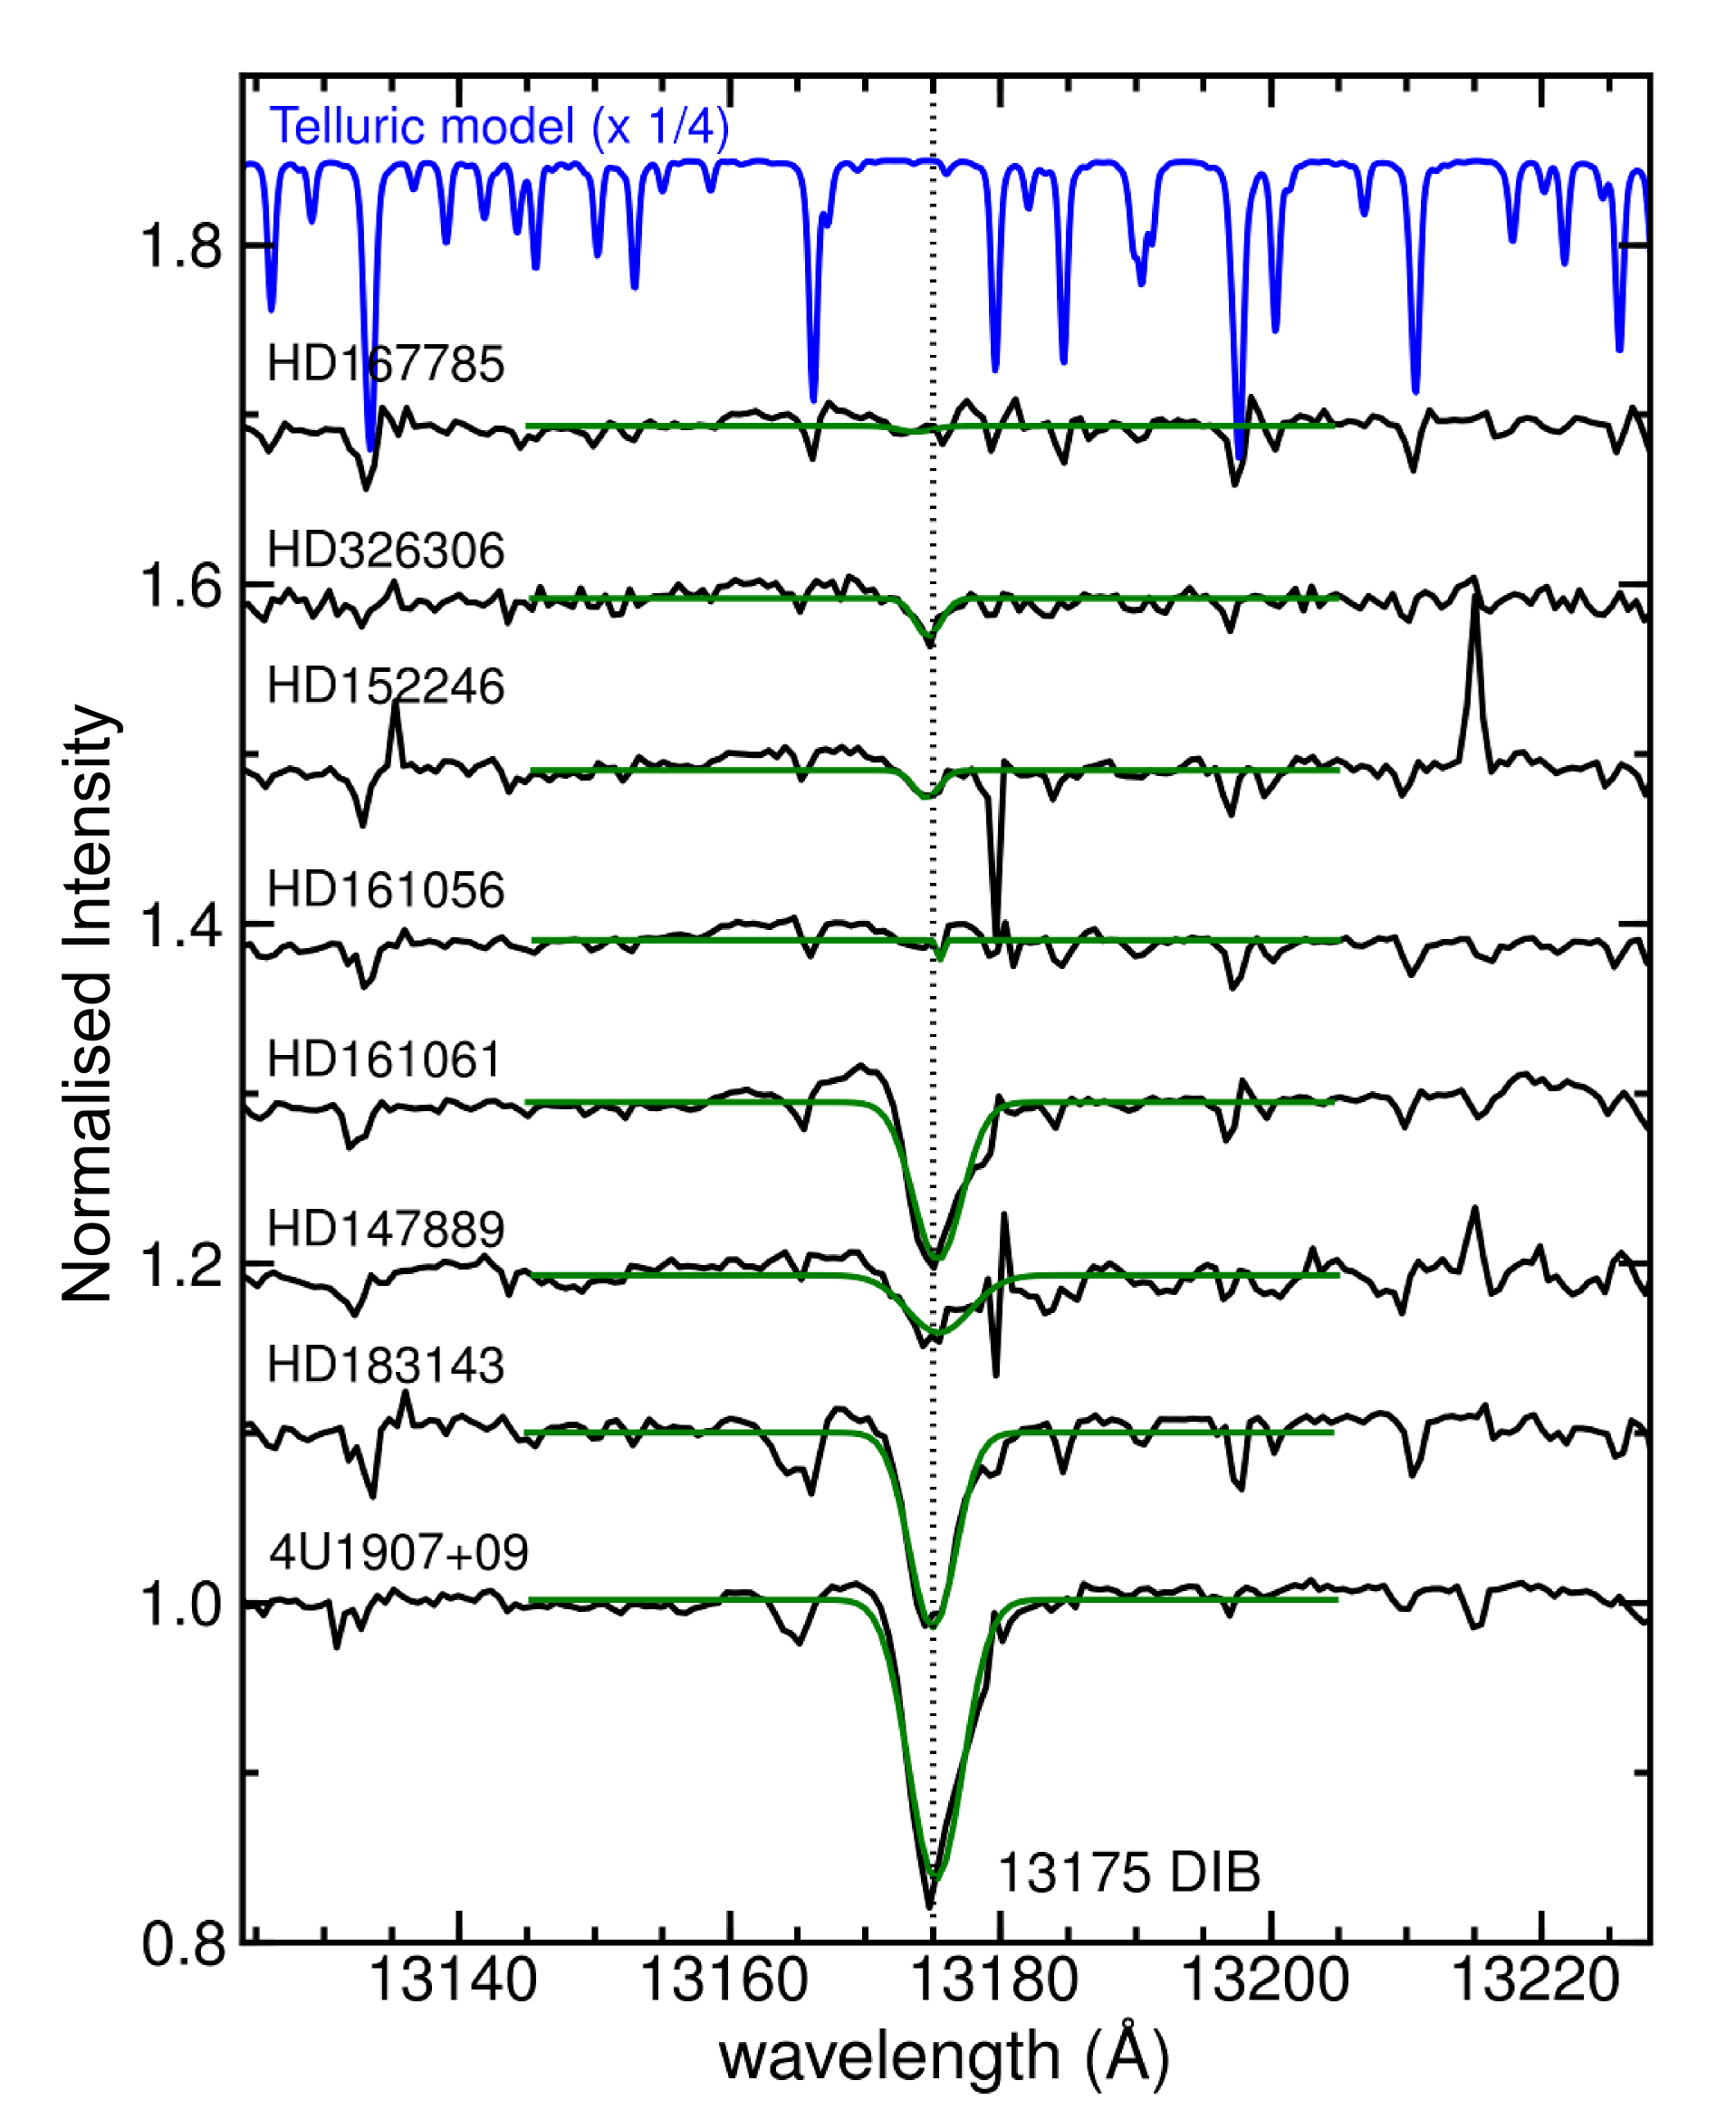
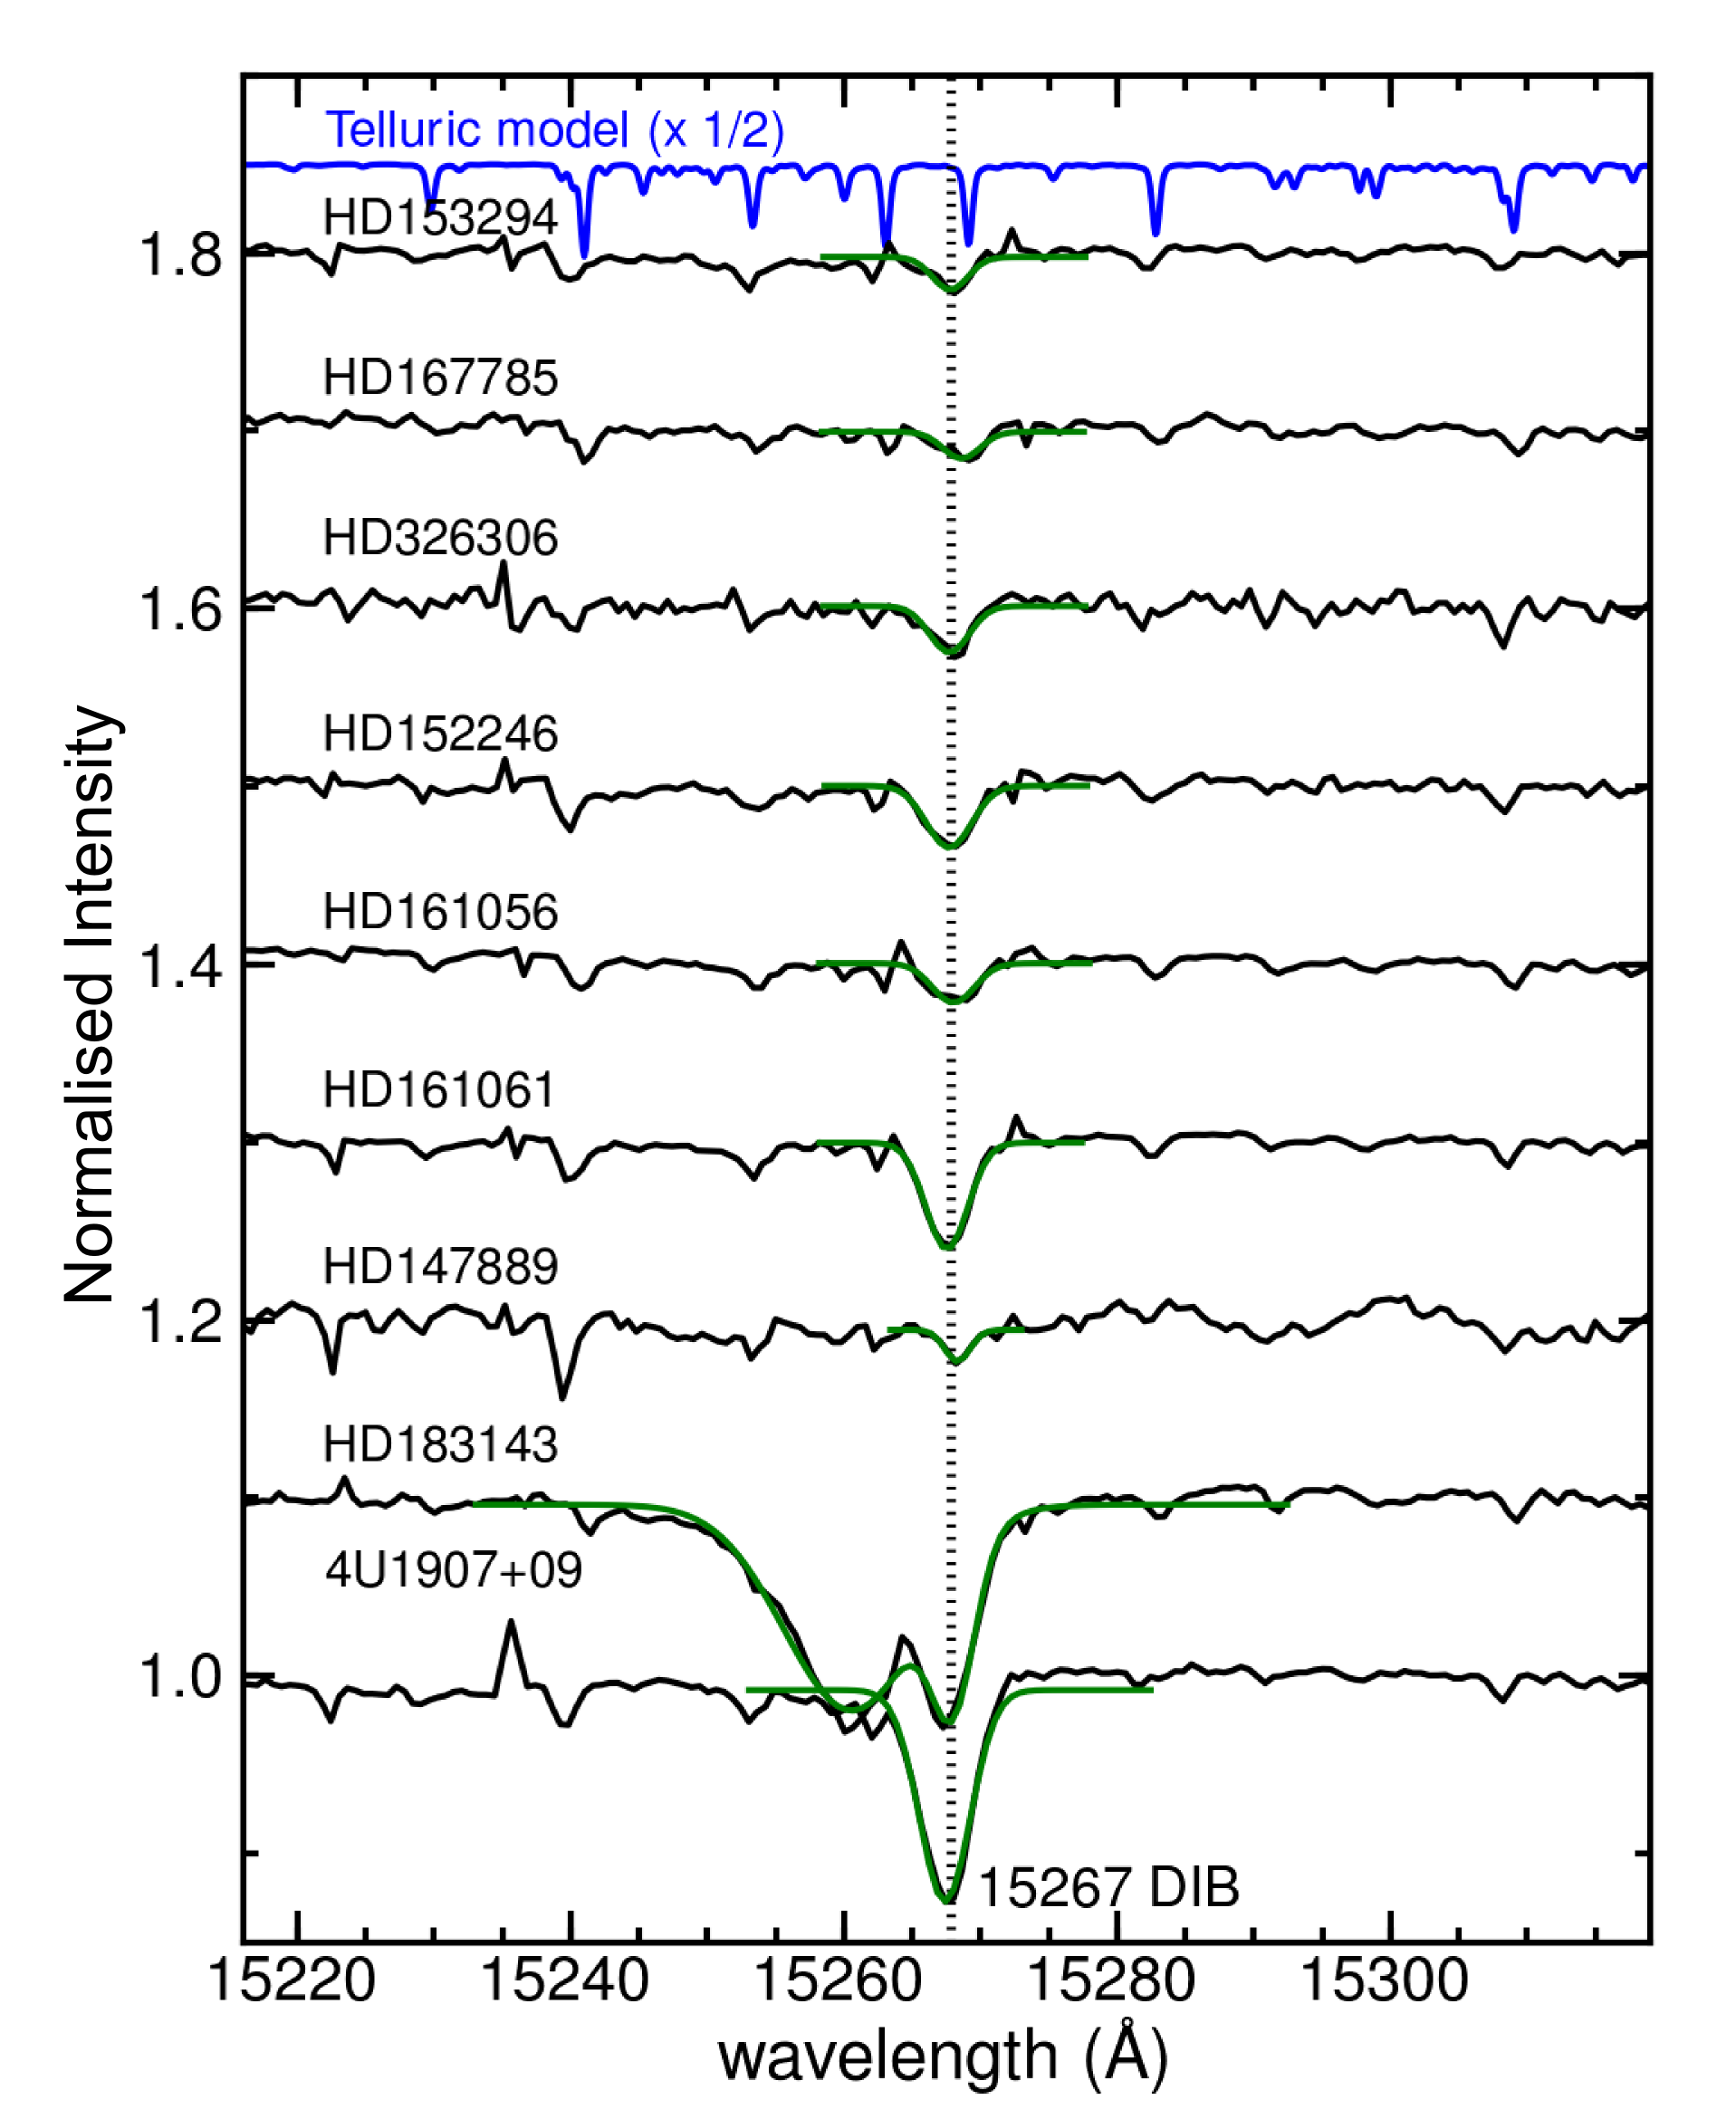
Fig. 4
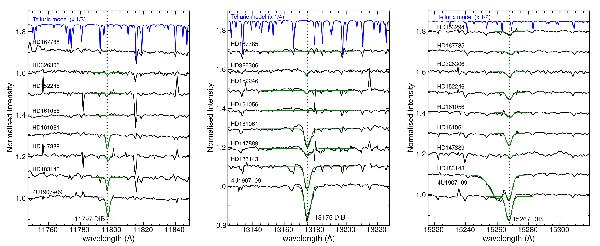
NIR DIBs at 11 797 Å (left panel), 13 175 Å (middle panel; Joblin et al. 1990), and 15 268 Å (right panel; Geballe et al. 2011) are shown for the X-Shooter sample of sightlines. The spectra have been corrected for the presence of telluric lines and subsequently for the radial velocity of the ISM. The dashed lines indicate the rest wavelength for the respective DIBs. Solid green curves show the Gaussian model fits and the blue solid curve displays the telluric model spectrum.
Current usage metrics show cumulative count of Article Views (full-text article views including HTML views, PDF and ePub downloads, according to the available data) and Abstracts Views on Vision4Press platform.
Data correspond to usage on the plateform after 2015. The current usage metrics is available 48-96 hours after online publication and is updated daily on week days.
Initial download of the metrics may take a while.