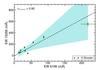
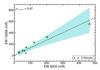
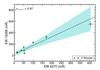
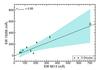
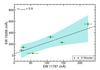
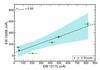
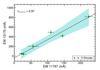
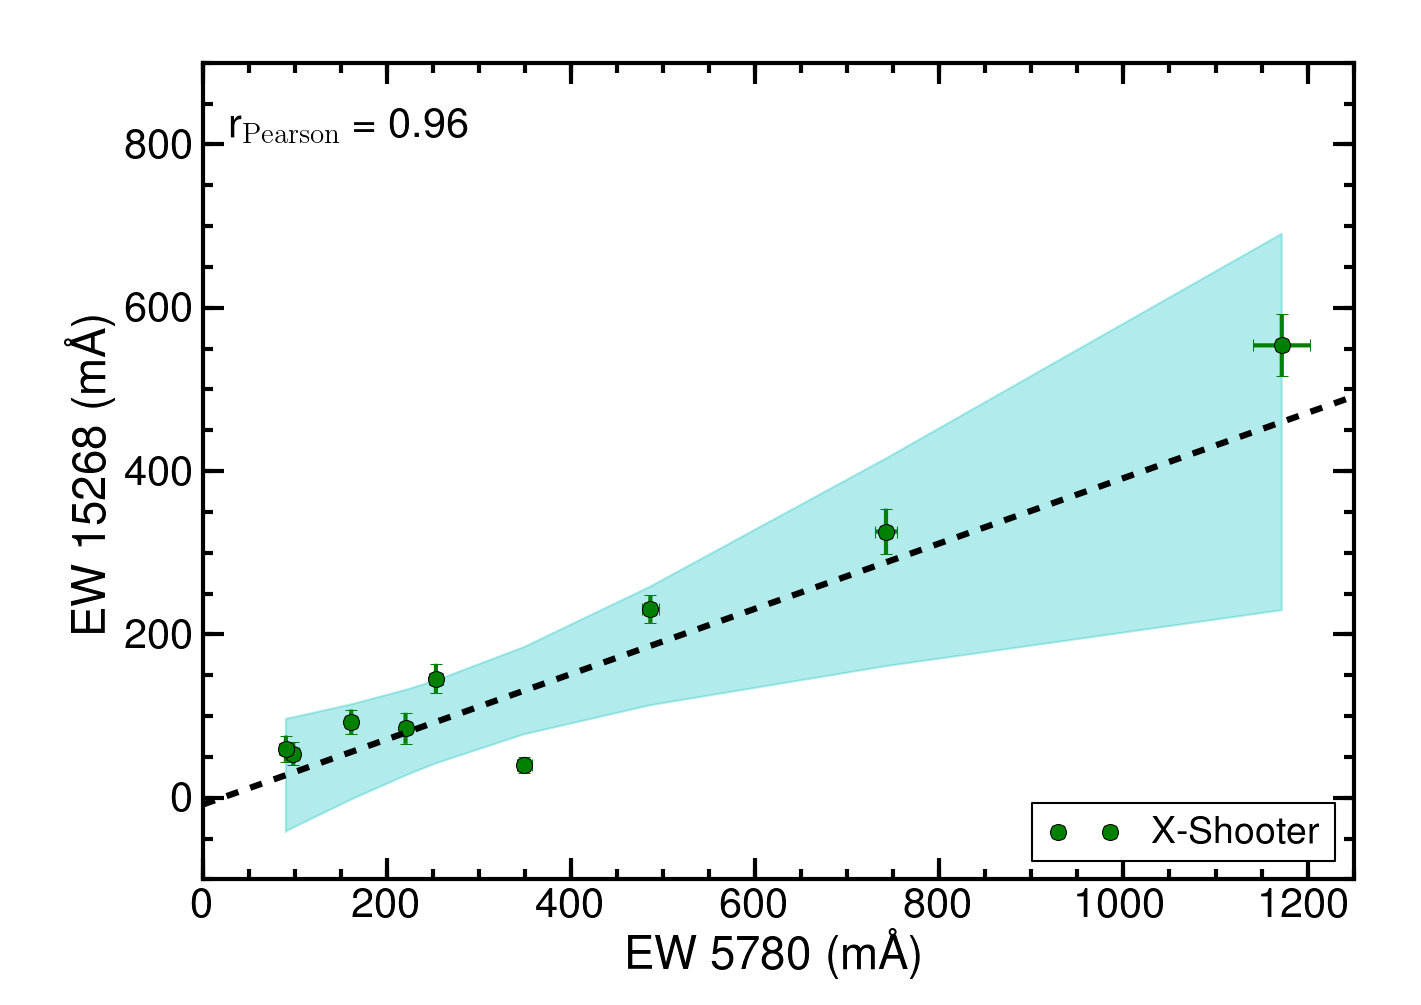
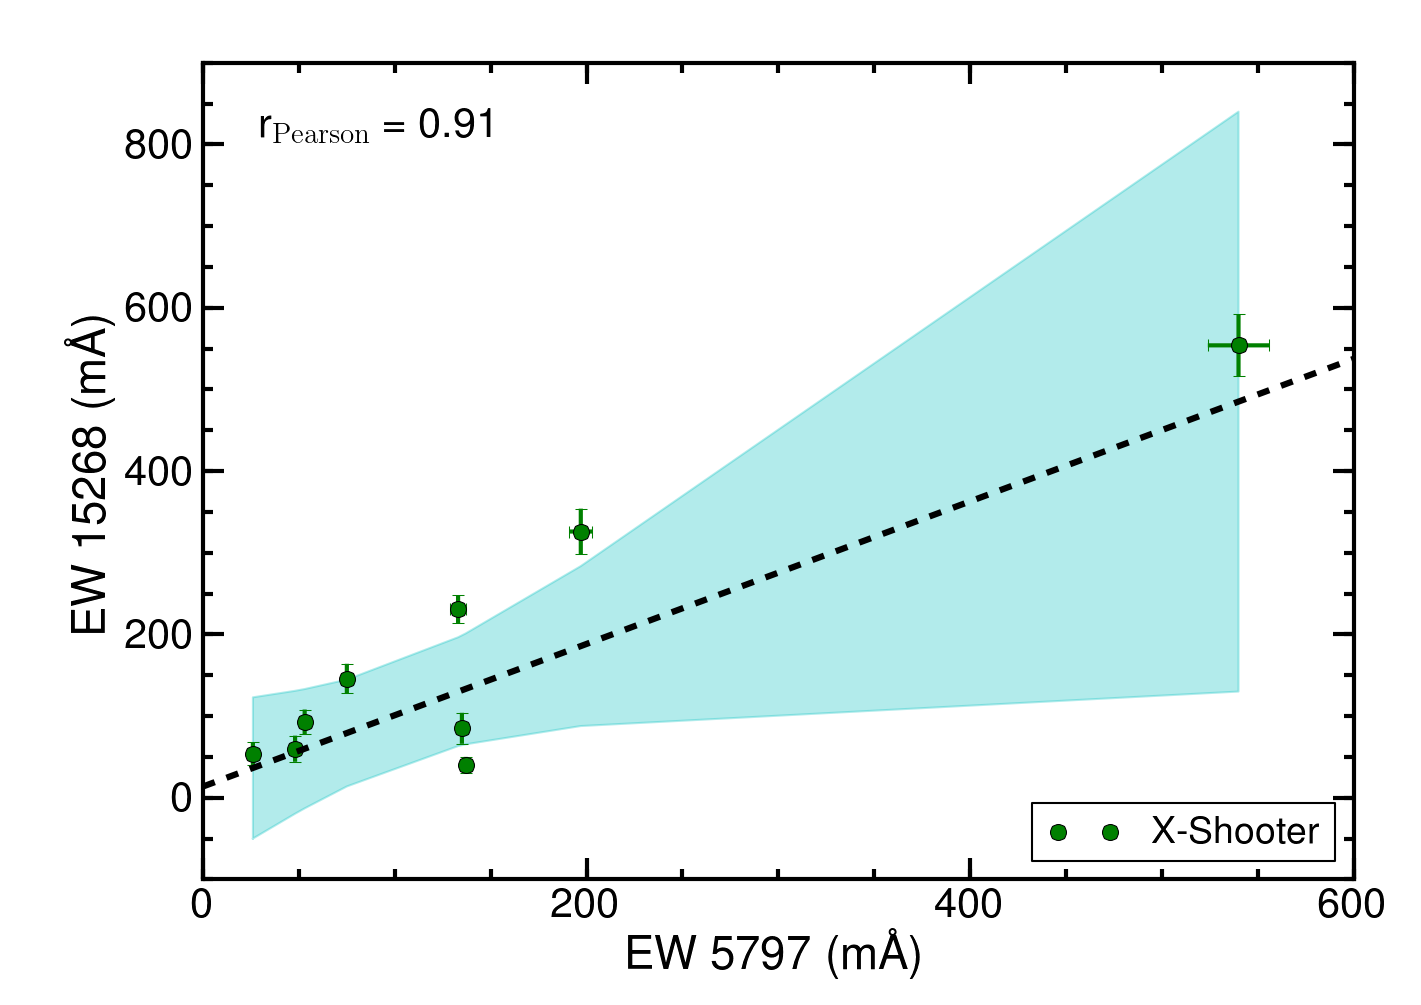
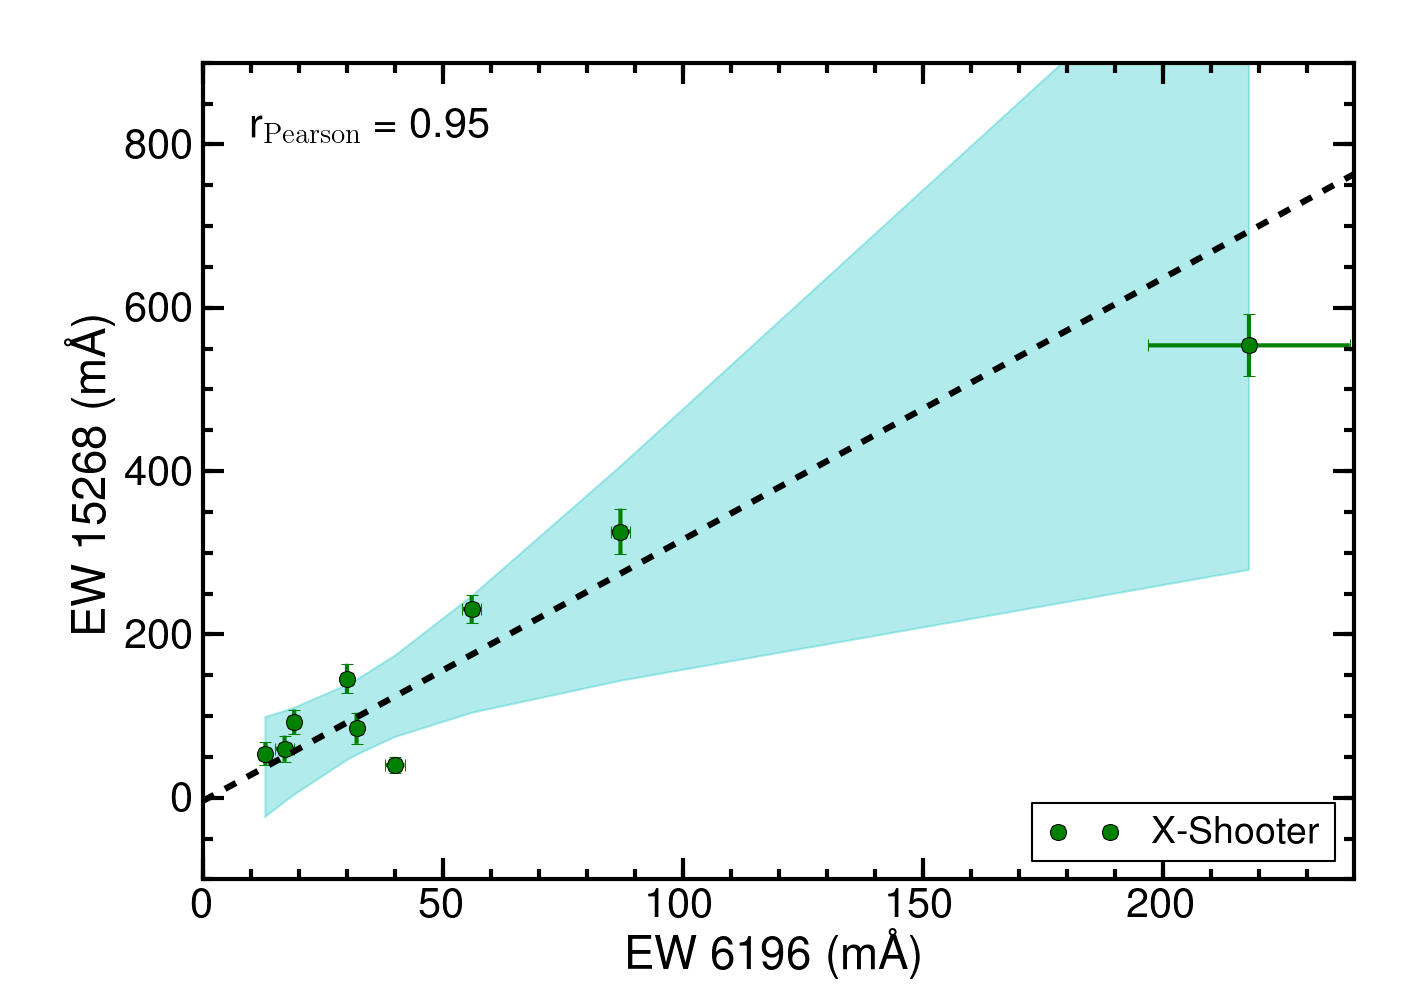
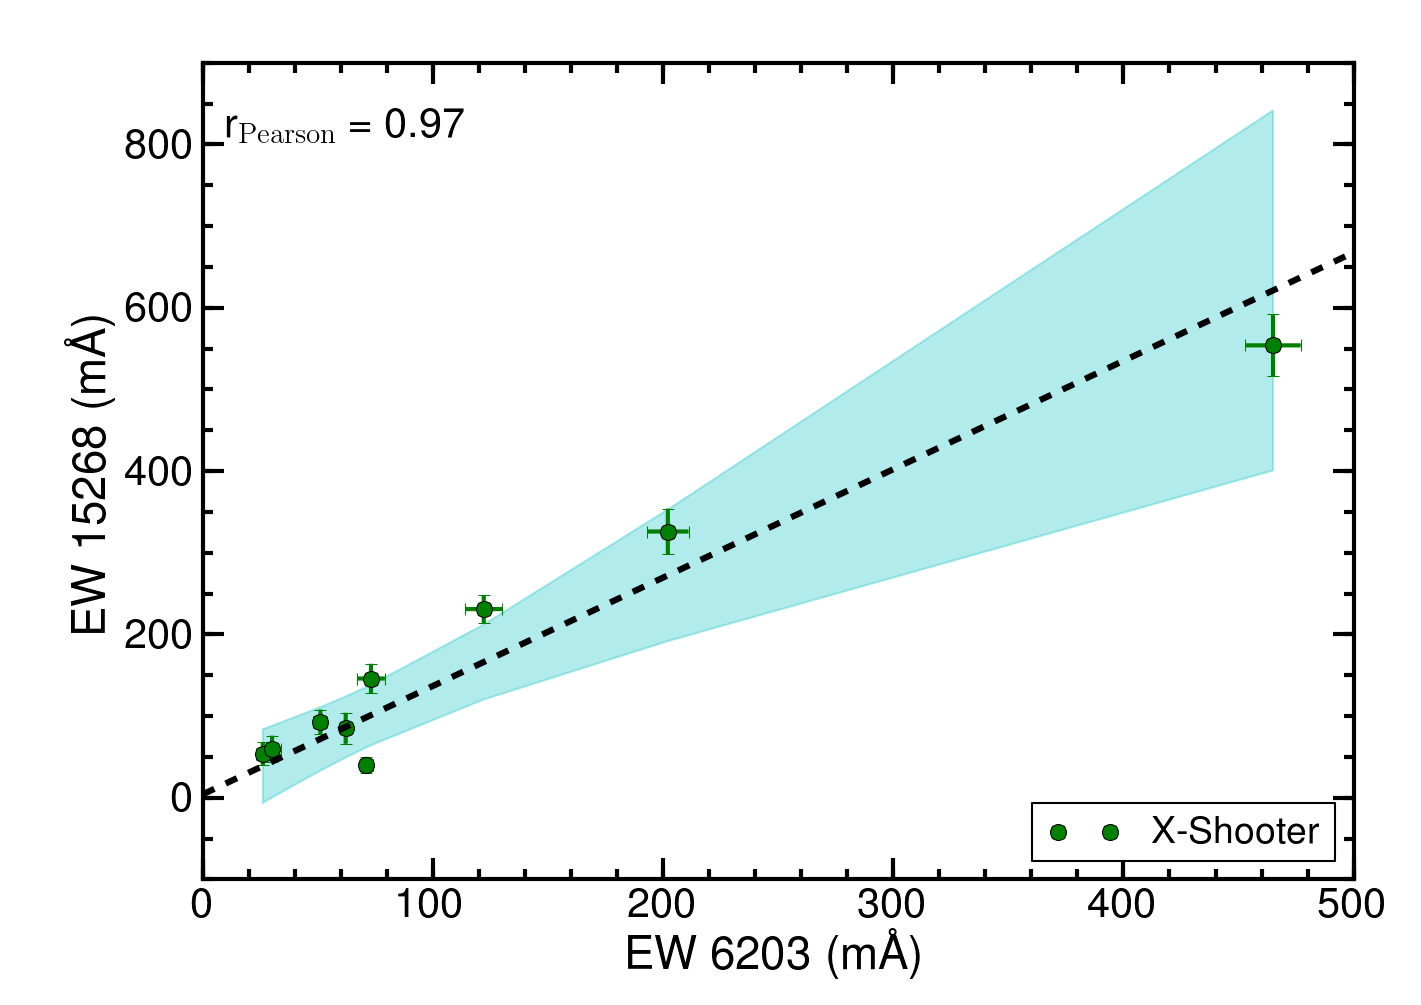
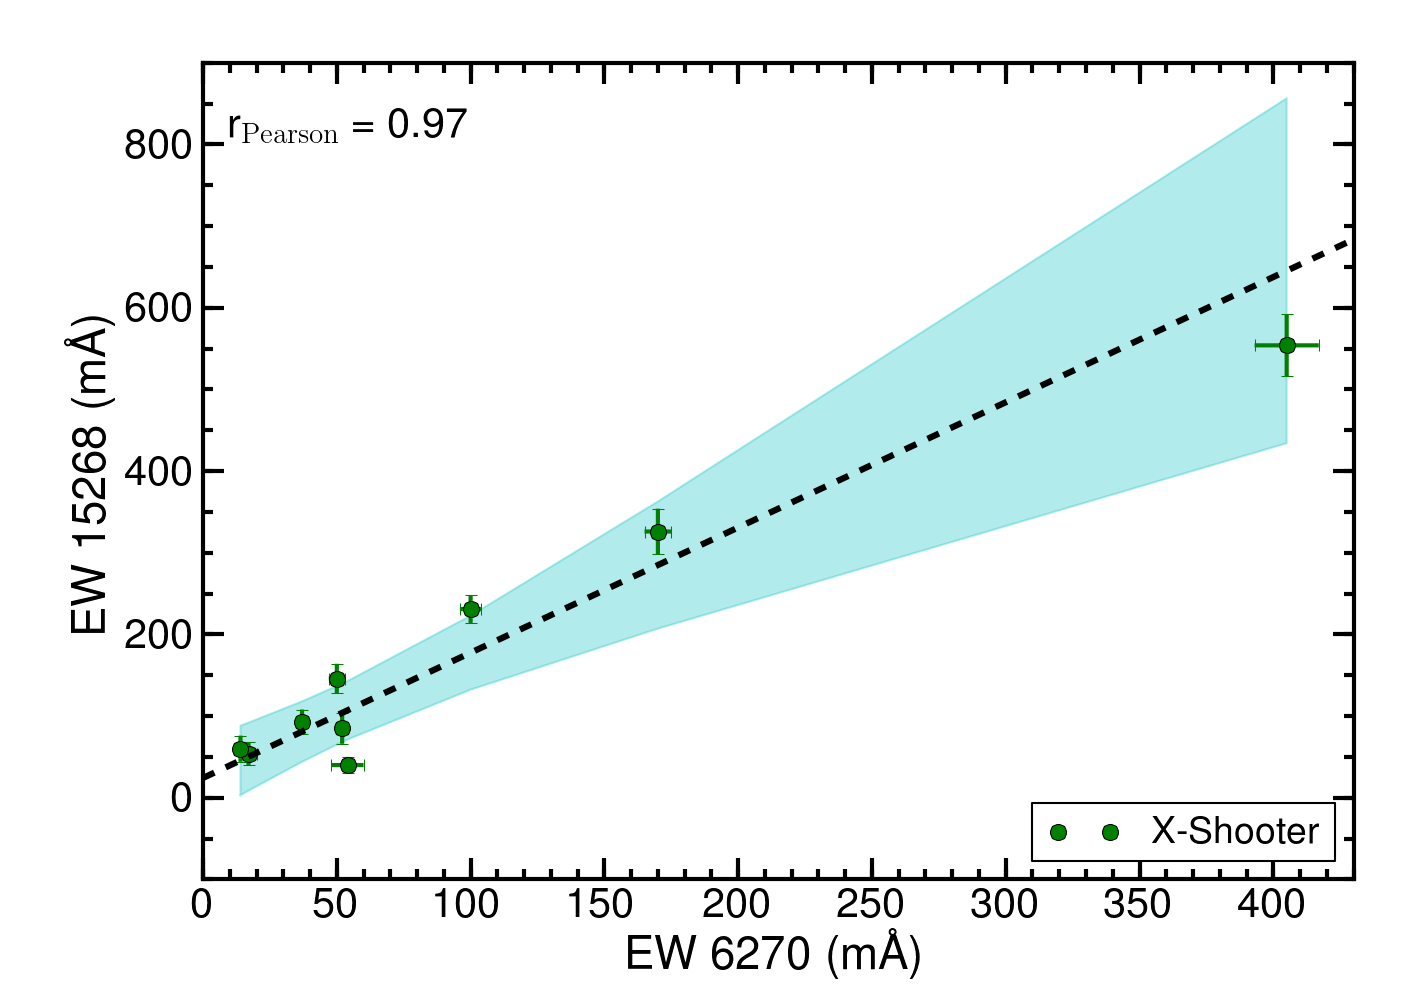
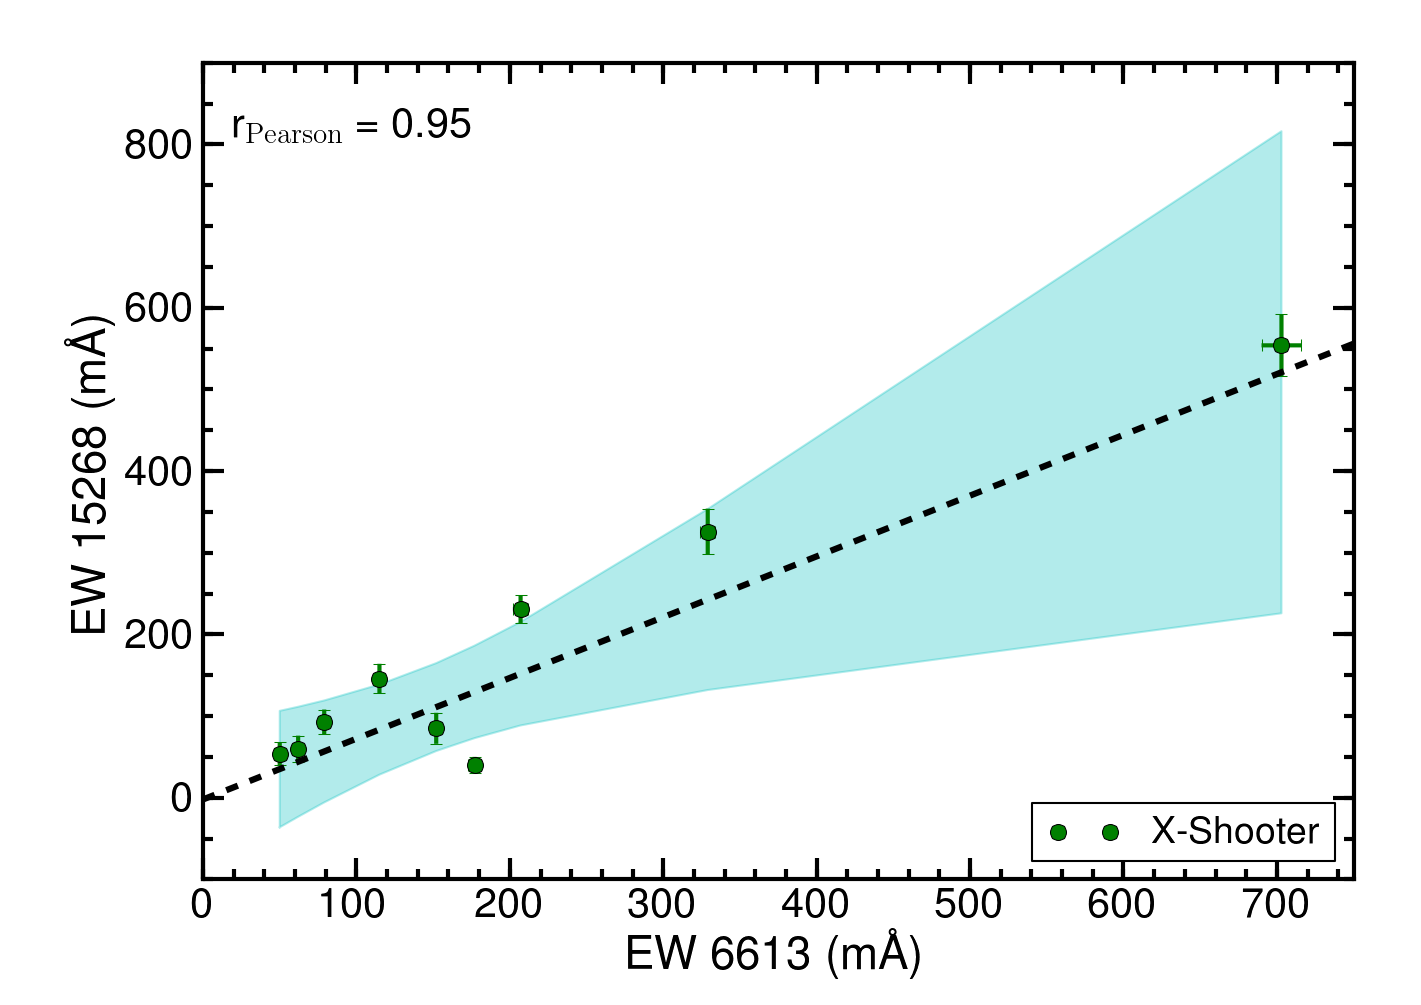
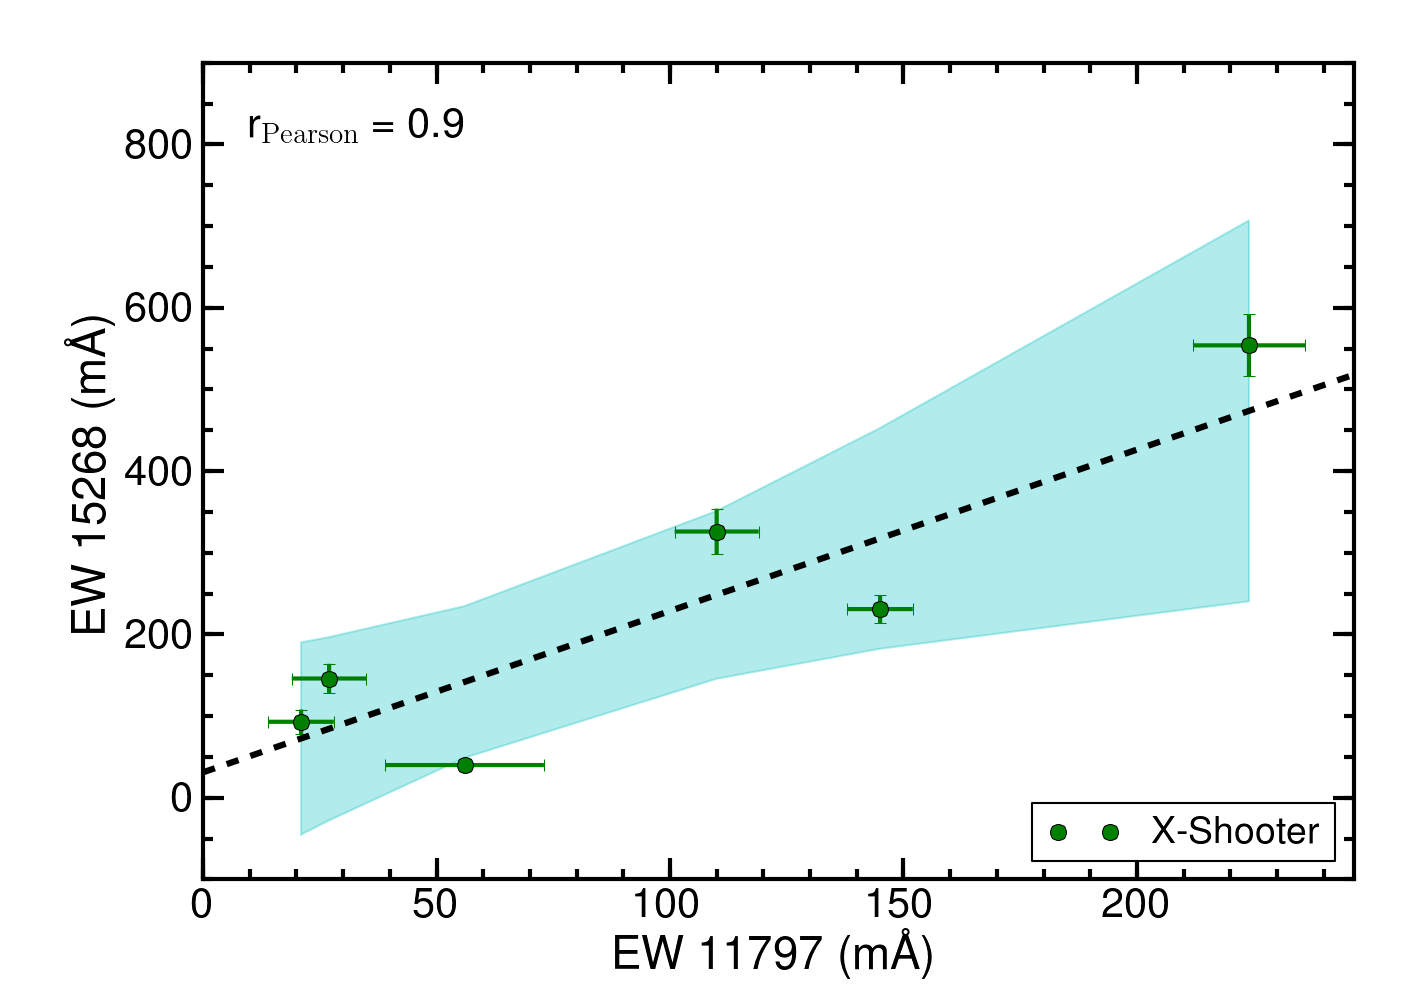
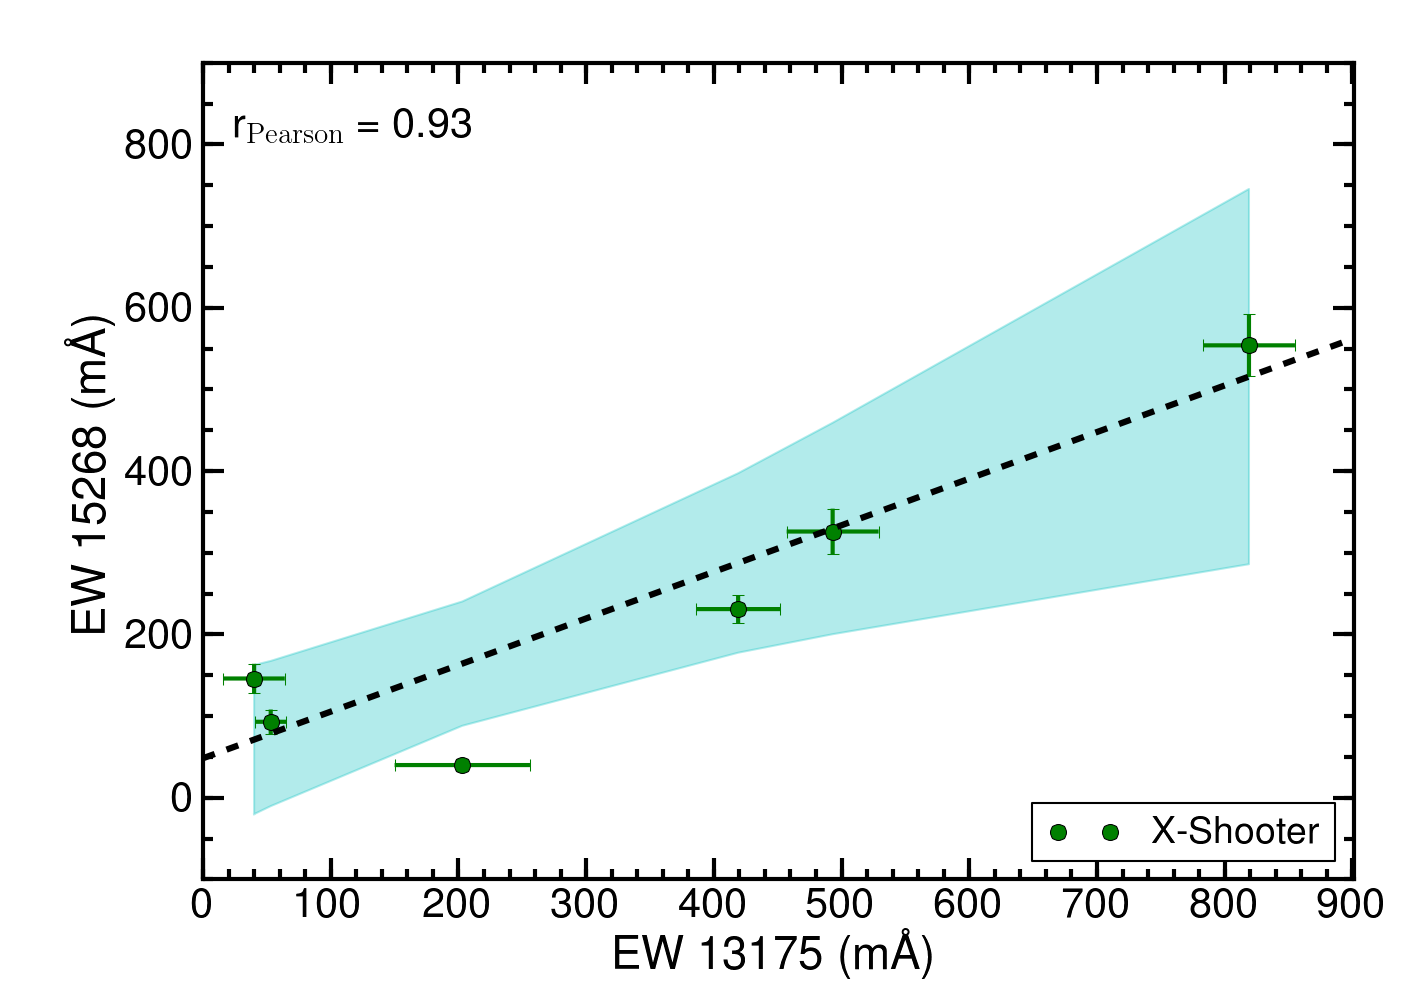
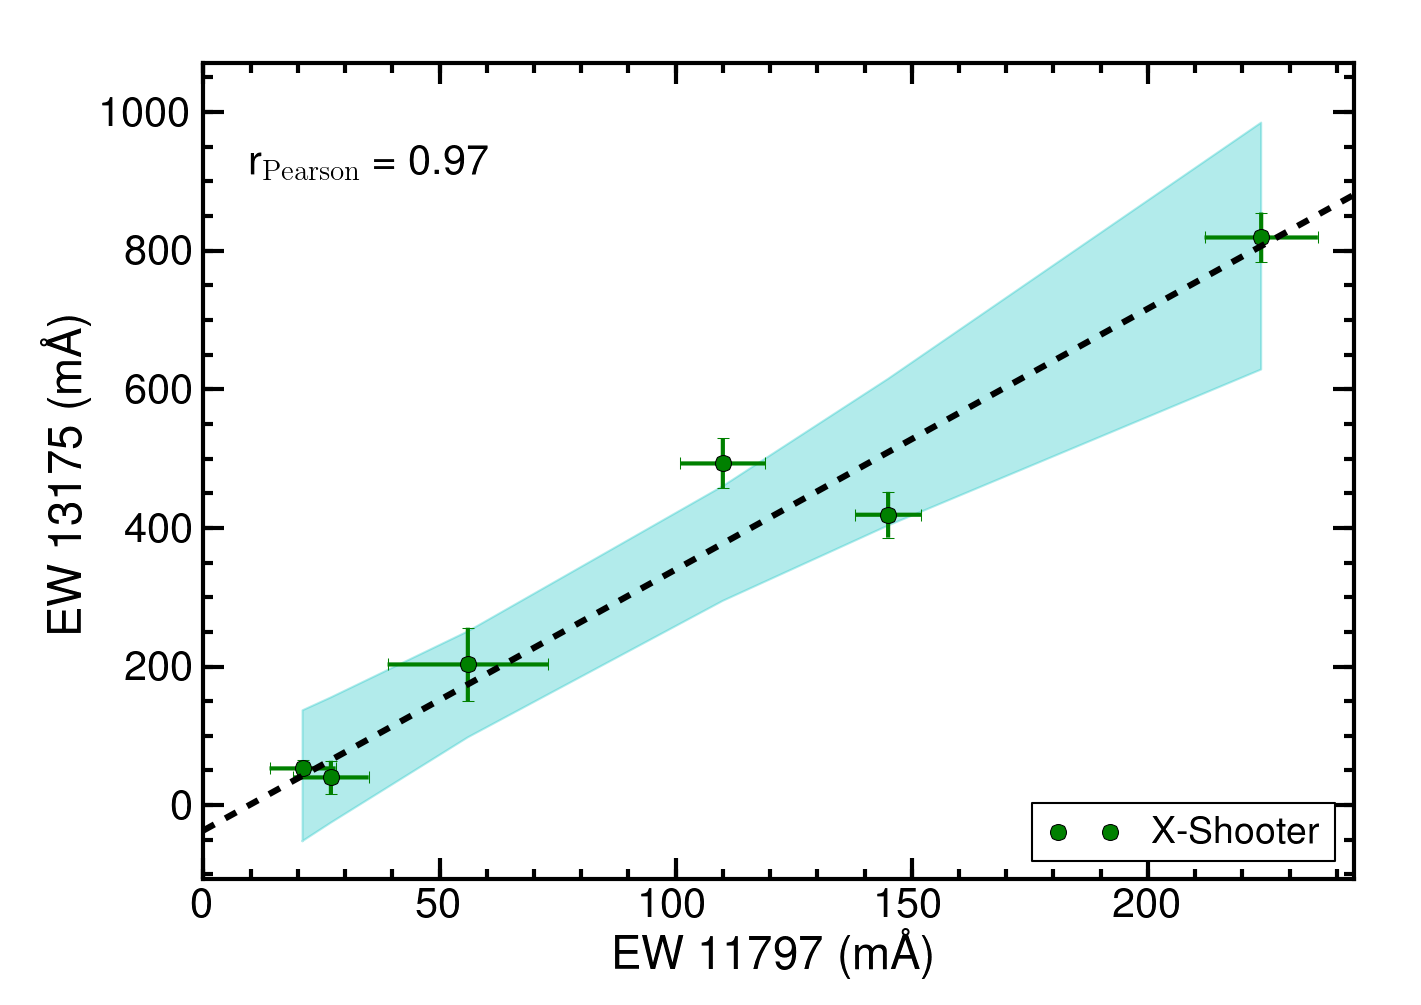
Fig. 10
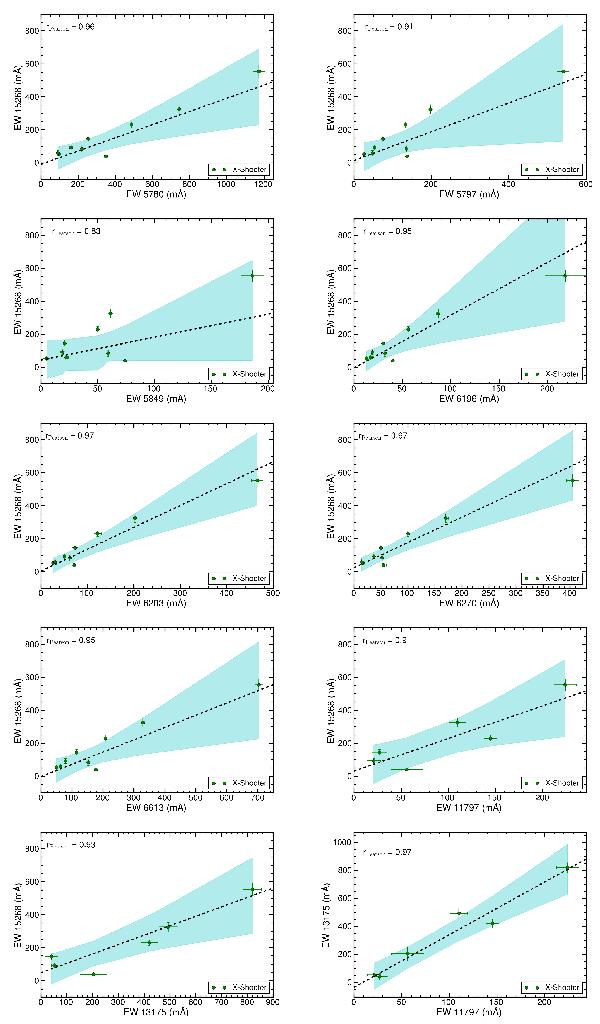
Relation between the 15 268 Å NIR DIB and the strong optical DIBs, and the 11 797 and 13 175 Å NIR DIBs. The correlation coefficients are given in each panel. In addition the 11 797−13 175 NIR DIBs are compared in the bottom right panel. The linear least-square fit is indicated by the black dashed line (parameters are given in Table 5) and the shaded cyan area indicate the 95% confidence interval.
Current usage metrics show cumulative count of Article Views (full-text article views including HTML views, PDF and ePub downloads, according to the available data) and Abstracts Views on Vision4Press platform.
Data correspond to usage on the plateform after 2015. The current usage metrics is available 48-96 hours after online publication and is updated daily on week days.
Initial download of the metrics may take a while.