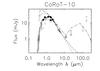
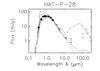
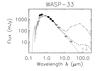
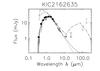
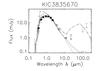
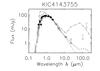
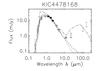
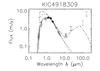
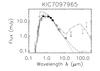
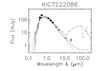
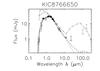
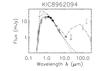
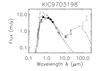
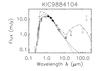
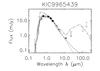
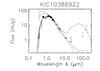
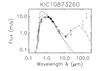
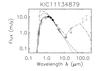
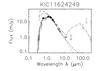
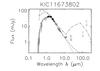
Fig. 2
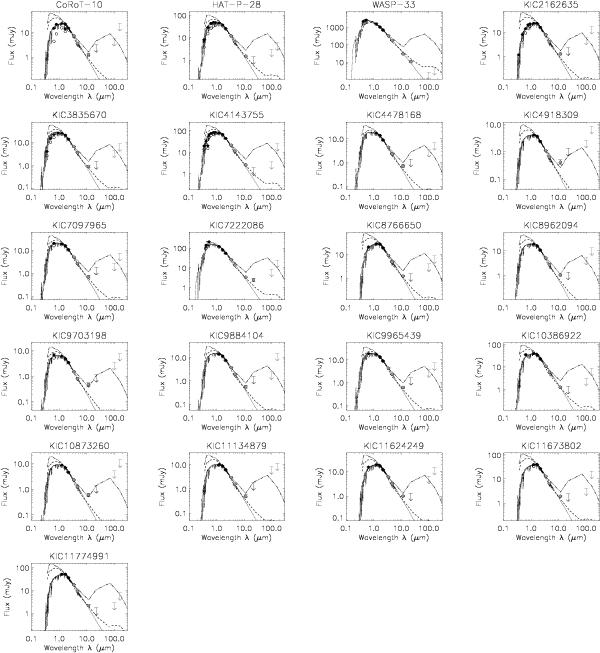
Spectral energy distributions (SEDs) of planet hosts and planet host candidates. The dotted line represents the stellar photosphere model for the spectral type of the star scaled to the dereddened J-band flux. Open and solid dots are observed and dereddened fluxes, respectively. Symbols in gray are WISE fluxes. The two longest wavelength flux upper limits are the Herschel/PACS observations. For comparison, the SEDs of η Crv (Duchêne et al. 2014) and β Pic (Vandenbussche et al. 2010) have been normalized to the dereddened J-band flux and added to each plot denoted by dashed and dot-dashed lines, respectively.

Current usage metrics show cumulative count of Article Views (full-text article views including HTML views, PDF and ePub downloads, according to the available data) and Abstracts Views on Vision4Press platform.
Data correspond to usage on the plateform after 2015. The current usage metrics is available 48-96 hours after online publication and is updated daily on week days.
Initial download of the metrics may take a while.