Fig. 15
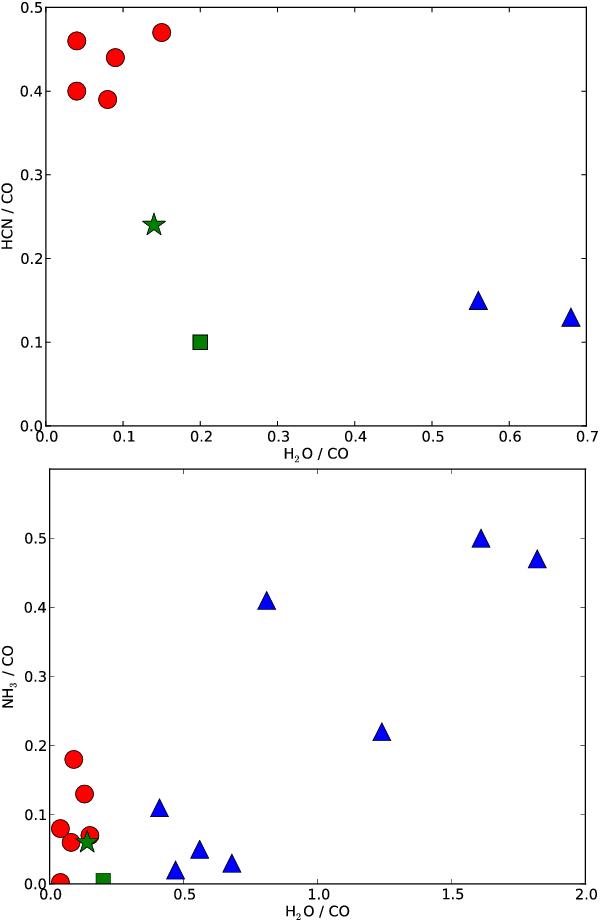
Line intensity ratios of HCN(13 → 12)/CO(6 → 5) and H2O((11,0 → 10,1))/CO(6 → 5) plotted against each other (top), and of NH3(10 → 00)/CO(6 → 5) and H2O((11,0 → 10,1))/CO(6 → 5) plotted against each other (bottom). The data are given in Table 8. The red circles are C stars, the blue triangles are M stars, and the two S stars are shown in green with W Aql being the star and χ Cyg the square. In the lower plot, the ratio shown for NH3/CO for χ Cyg is an upper limit. The χ Cyg values are taken from Schöier et al. (2011).
Current usage metrics show cumulative count of Article Views (full-text article views including HTML views, PDF and ePub downloads, according to the available data) and Abstracts Views on Vision4Press platform.
Data correspond to usage on the plateform after 2015. The current usage metrics is available 48-96 hours after online publication and is updated daily on week days.
Initial download of the metrics may take a while.