Fig. 1
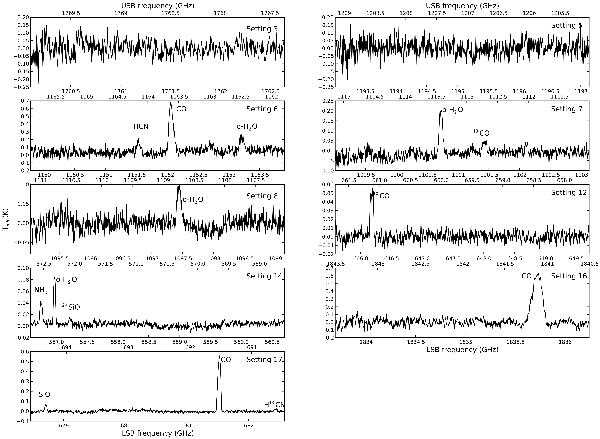
Spectra of W Aql as observed using HIFI. The top right corner of each spectrum gives the frequency setting within the HIFISTARS project. Strong lines are labelled with their corresponding molecule identification. The spectra are obtained in double sideband mode, and the lower sideband (LSB) and upper sideband (USB) frequencies are given below and above the spectra, respectively. The spectra are corrected for baseline effects (see text). The intensity scale is given in main beam brightness temperature.
Current usage metrics show cumulative count of Article Views (full-text article views including HTML views, PDF and ePub downloads, according to the available data) and Abstracts Views on Vision4Press platform.
Data correspond to usage on the plateform after 2015. The current usage metrics is available 48-96 hours after online publication and is updated daily on week days.
Initial download of the metrics may take a while.