Fig. 9
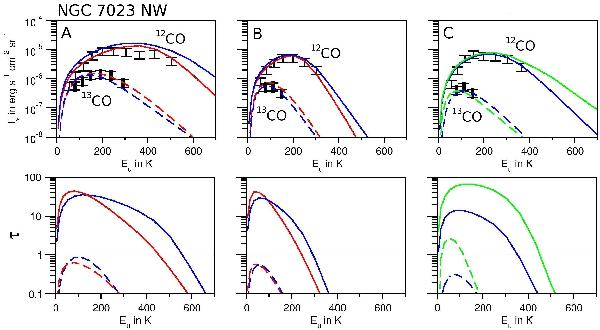
Top: integrated line intensities as a function of Eu for the
positions A, B, and C. The lines indicate the best fits of the observed integrated
line intensities with RADEX: red for nH = 106
cm-3, blue
for nH =
105 cm-3, and green for nH =
104 cm-3. Bottom: optical depth
τ
calculated with RADEX versus Eu for the positions A, B, and C.
 : thin
symbols, solid line,
: thin
symbols, solid line,  : thick
symbols, dashed line. The results are summarised in Table 2.
: thick
symbols, dashed line. The results are summarised in Table 2.
Current usage metrics show cumulative count of Article Views (full-text article views including HTML views, PDF and ePub downloads, according to the available data) and Abstracts Views on Vision4Press platform.
Data correspond to usage on the plateform after 2015. The current usage metrics is available 48-96 hours after online publication and is updated daily on week days.
Initial download of the metrics may take a while.