Fig. 7
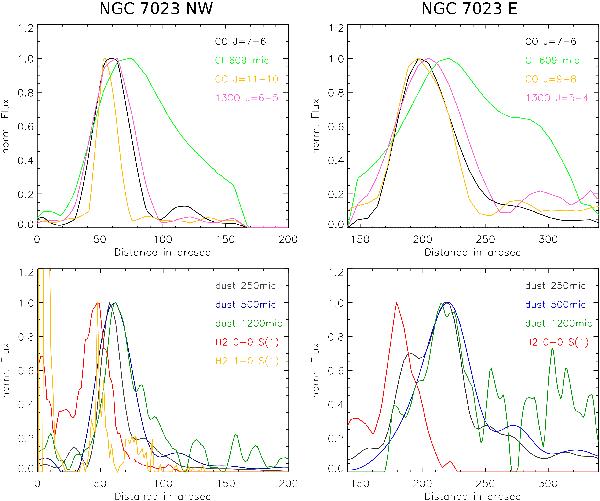
Emission profiles for CO and C0 (top) and dust and H2 (bottom) for NGC 7023 NW (left) and NGC 7023 E (right) along the cuts shown in Fig. 6, as a function of the distance from the star in arcsec. We use the HR data for this plot, so that the beam size is not constant with wavelength, which affects the width of the emission profiles. Angular resolutions are ~ 1′′ for H2 1−0 S(1), ~ 10′′ for H2 0−0 S(1), between ~≤17–40′′ for CO lines and dust emission, ~ 40′′ for C0 609 μm, and 11” for the dust emission at 1.2 mm (IRAM-30 m data).
Current usage metrics show cumulative count of Article Views (full-text article views including HTML views, PDF and ePub downloads, according to the available data) and Abstracts Views on Vision4Press platform.
Data correspond to usage on the plateform after 2015. The current usage metrics is available 48-96 hours after online publication and is updated daily on week days.
Initial download of the metrics may take a while.