Fig. 6
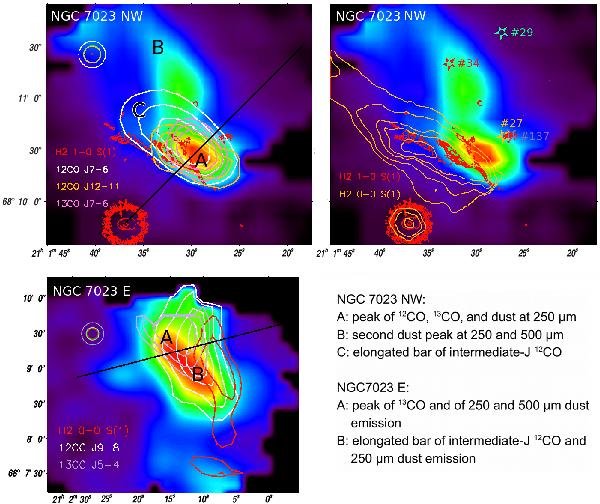
Top left: FTS map at 250 μm of the PDR NGC
7023 NW with contours of  J = 7–6 (white),
(maximum at 1.5 ×
10-5erg
cm-2s-1sr-1 with contour
lines at 0.4, 0.6, 0.8 times the maximum), J = 12–11 (orange)
(maximum at 4.0 ×
10-5erg
cm-2s-1sr-1 with contour
lines at 0.2, 0.4, 0.6 times the maximum), and
J = 7–6 (white),
(maximum at 1.5 ×
10-5erg
cm-2s-1sr-1 with contour
lines at 0.4, 0.6, 0.8 times the maximum), J = 12–11 (orange)
(maximum at 4.0 ×
10-5erg
cm-2s-1sr-1 with contour
lines at 0.2, 0.4, 0.6 times the maximum), and
 J = 7–6 (pink)
(maximum at 3.2 ×
10-6erg
cm-2s-1sr-1 with contour
lines at 0.4, 0.6, 0.8 times the maximum) and H2 1−0 S(1) (red) from Lemaire et al. (1996) (maximum at
3.7 ×
10-4erg
cm-2s-1sr-1 with contours at
0.27, 0.41, 0.55, 0.69 times the maximum). Top right: FTS map at
250 μm of the PDR NGC 7023 NW with contours of
H2
0−0 S(1) (orange)
from Spitzer observations (maximum at 1.9 × 10⁻⁴erg
cm-2s-1sr-1 with contour lines
at 0.26, 0.36, 0.52, 0.62, 0.83 times the maximum) and H2 1−0 S(1) (red) (maximum at
3.7 ×
10-4erg
cm-2s-1sr-1 with contours at
0.27, 0.41, 0.55, 0.69 times the maximum). Bottom: FTS map of the
PDR NGC 7023 E, 250 μm map with contours of
J = 9–8 (white)
(maximum at 3.2 ×
10-6erg
cm-2s-1sr-1 with contour
lines at 0.4, 0.6, 0.8 times the maximum), J = 5–4 (violet)
(maximum at 5.6 ×
10-7erg
cm-2s-1sr-1 with contour
lines at 0.7, 0.8, 0.9 times the maximum) and H2 0−0 S(1) (red) from Spitzer
observations (maximum at 1.3 ×
10-4erg
cm-2s-1sr-1 with contour
lines at 0.45, 0.66 times the maximum). Note that the FTS map at long wavelengths
(SLW) is slightly smaller than the shown map, so that the
J = 5–4 contour
lines are cut off in the north. The letters A, B, and C indicate positions of
interest as explained. We include the detected YSOs by Kirk et al. (2009) as stars in the top right figure. The FWHM
of the beam for the different CO and the beam size for H2 lines are presented.
Maps: 12.2′′ (green). NGC 7023 NW: 11.6′′ for
12CO
J =
12–11 (orange), 18.6′′ for 12CO J = 7–6 (white),
18.7′′
for 13CO
J =
7–6 (white) and 1′′ for H2 1−0 S(1) (red). NGC 7023 E:
13.0′′
for 12CO
J =
9–8 (white), 22.7′′ for 13CO J = 5–4 (violet)
and 11′′
for H2
0−0 S(1) (red).
J = 7–6 (pink)
(maximum at 3.2 ×
10-6erg
cm-2s-1sr-1 with contour
lines at 0.4, 0.6, 0.8 times the maximum) and H2 1−0 S(1) (red) from Lemaire et al. (1996) (maximum at
3.7 ×
10-4erg
cm-2s-1sr-1 with contours at
0.27, 0.41, 0.55, 0.69 times the maximum). Top right: FTS map at
250 μm of the PDR NGC 7023 NW with contours of
H2
0−0 S(1) (orange)
from Spitzer observations (maximum at 1.9 × 10⁻⁴erg
cm-2s-1sr-1 with contour lines
at 0.26, 0.36, 0.52, 0.62, 0.83 times the maximum) and H2 1−0 S(1) (red) (maximum at
3.7 ×
10-4erg
cm-2s-1sr-1 with contours at
0.27, 0.41, 0.55, 0.69 times the maximum). Bottom: FTS map of the
PDR NGC 7023 E, 250 μm map with contours of
J = 9–8 (white)
(maximum at 3.2 ×
10-6erg
cm-2s-1sr-1 with contour
lines at 0.4, 0.6, 0.8 times the maximum), J = 5–4 (violet)
(maximum at 5.6 ×
10-7erg
cm-2s-1sr-1 with contour
lines at 0.7, 0.8, 0.9 times the maximum) and H2 0−0 S(1) (red) from Spitzer
observations (maximum at 1.3 ×
10-4erg
cm-2s-1sr-1 with contour
lines at 0.45, 0.66 times the maximum). Note that the FTS map at long wavelengths
(SLW) is slightly smaller than the shown map, so that the
J = 5–4 contour
lines are cut off in the north. The letters A, B, and C indicate positions of
interest as explained. We include the detected YSOs by Kirk et al. (2009) as stars in the top right figure. The FWHM
of the beam for the different CO and the beam size for H2 lines are presented.
Maps: 12.2′′ (green). NGC 7023 NW: 11.6′′ for
12CO
J =
12–11 (orange), 18.6′′ for 12CO J = 7–6 (white),
18.7′′
for 13CO
J =
7–6 (white) and 1′′ for H2 1−0 S(1) (red). NGC 7023 E:
13.0′′
for 12CO
J =
9–8 (white), 22.7′′ for 13CO J = 5–4 (violet)
and 11′′
for H2
0−0 S(1) (red).
Current usage metrics show cumulative count of Article Views (full-text article views including HTML views, PDF and ePub downloads, according to the available data) and Abstracts Views on Vision4Press platform.
Data correspond to usage on the plateform after 2015. The current usage metrics is available 48-96 hours after online publication and is updated daily on week days.
Initial download of the metrics may take a while.