Fig. 5
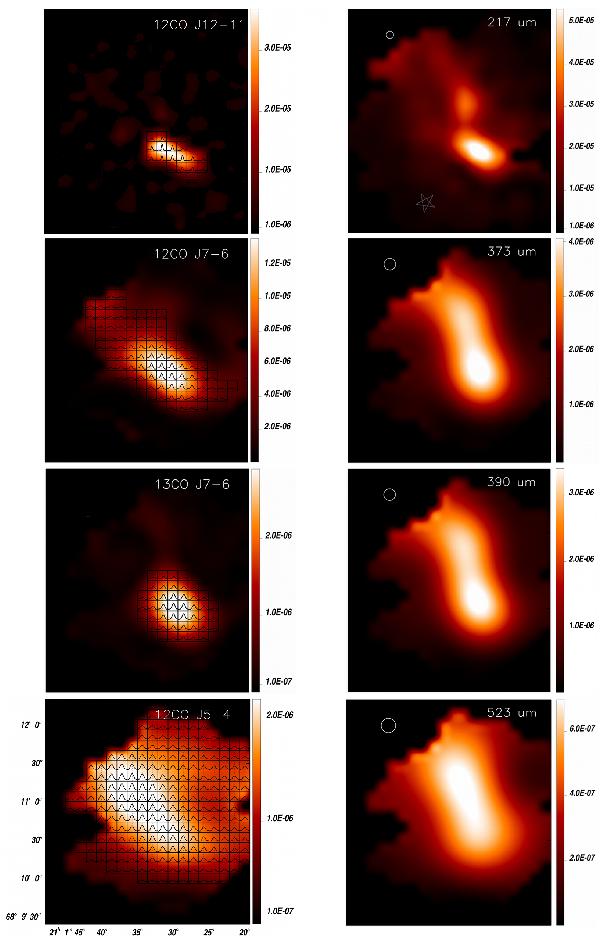
Left column: spatial distribution of
 (J =
12–11),
(J =
7–6),
(J =
12–11),
(J =
7–6),  (J =
7–6) and
(J =
5–4) for NGC 7023 NW. The bars give intensities in
erg
s-1cm-2sr-1. Right
column: spatial distribution of dust emission at the wavelength close
to the line emission. The bars give νIν
in Wm-2sr-1. All images are presented with
the same scale, same field, and same centre. We include the FWHM of the beam in
the dust emission maps: 11.6′′, 18.6′′, 18.7′′, 21.3′′ from top
to bottom.
(J =
7–6) and
(J =
5–4) for NGC 7023 NW. The bars give intensities in
erg
s-1cm-2sr-1. Right
column: spatial distribution of dust emission at the wavelength close
to the line emission. The bars give νIν
in Wm-2sr-1. All images are presented with
the same scale, same field, and same centre. We include the FWHM of the beam in
the dust emission maps: 11.6′′, 18.6′′, 18.7′′, 21.3′′ from top
to bottom.
Current usage metrics show cumulative count of Article Views (full-text article views including HTML views, PDF and ePub downloads, according to the available data) and Abstracts Views on Vision4Press platform.
Data correspond to usage on the plateform after 2015. The current usage metrics is available 48-96 hours after online publication and is updated daily on week days.
Initial download of the metrics may take a while.