Fig. 4
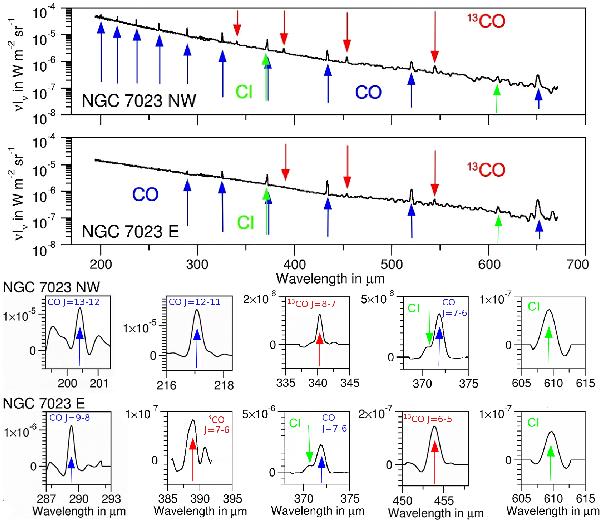
Spectrum at the position of brightest emission for NGC 7023 NW and NGC 7023 E (top), showing the HR spectrum. A zoomed-in spectrum is shown for the weaker lines where we subtracted the continuum emission. For NGC 7023 NW and E, these positions of brightest emission are called position A in the following (see Fig. 6).
Current usage metrics show cumulative count of Article Views (full-text article views including HTML views, PDF and ePub downloads, according to the available data) and Abstracts Views on Vision4Press platform.
Data correspond to usage on the plateform after 2015. The current usage metrics is available 48-96 hours after online publication and is updated daily on week days.
Initial download of the metrics may take a while.