Fig. 2
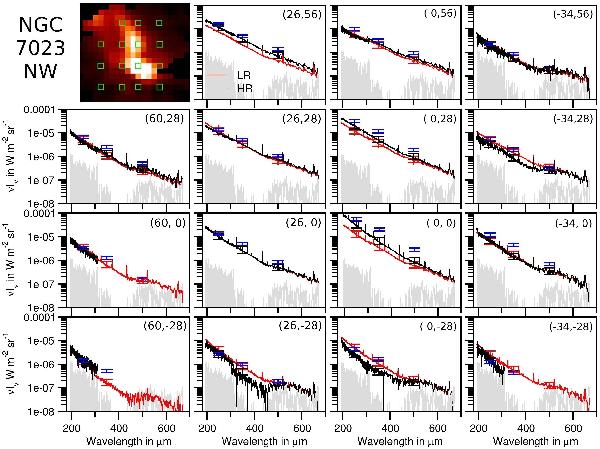
Obtained FTS spectra with the HR cube (black curves) and photometer data (blue signs) at different positions in NGC 7023 NW indicated as green squares in the map. The black signs are the HR FTS data integrated over the photometric filters using the extended source calibration. The red curves indicate the LR spectrum and the red signs the LR FTS data integrated over the photometric filters using the extended source calibration. The grey curves present the background spectrum. Some positions are outside the observation area for SLW. Calibration errors of 15% for the photometer and 30% for the integrated FTS data are included. The offsets in arcsec from the position of the brightest spectrum are included.
Current usage metrics show cumulative count of Article Views (full-text article views including HTML views, PDF and ePub downloads, according to the available data) and Abstracts Views on Vision4Press platform.
Data correspond to usage on the plateform after 2015. The current usage metrics is available 48-96 hours after online publication and is updated daily on week days.
Initial download of the metrics may take a while.