Fig. 14
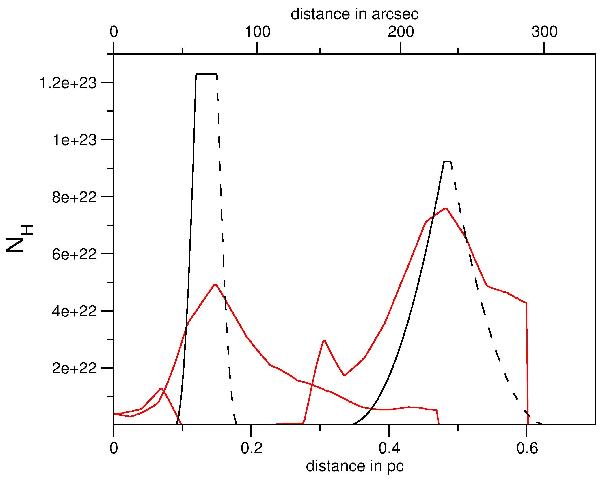
H column density profiles for NGC 7023 NW (left curves) and NGC 7023 E (right curves) derived with the black body approach (red curves) and the radiative transfer calculations (black curves). Since the slope of the decreasing density is ambiguous, we present it as a dashed line.
Current usage metrics show cumulative count of Article Views (full-text article views including HTML views, PDF and ePub downloads, according to the available data) and Abstracts Views on Vision4Press platform.
Data correspond to usage on the plateform after 2015. The current usage metrics is available 48-96 hours after online publication and is updated daily on week days.
Initial download of the metrics may take a while.