Fig. A.1
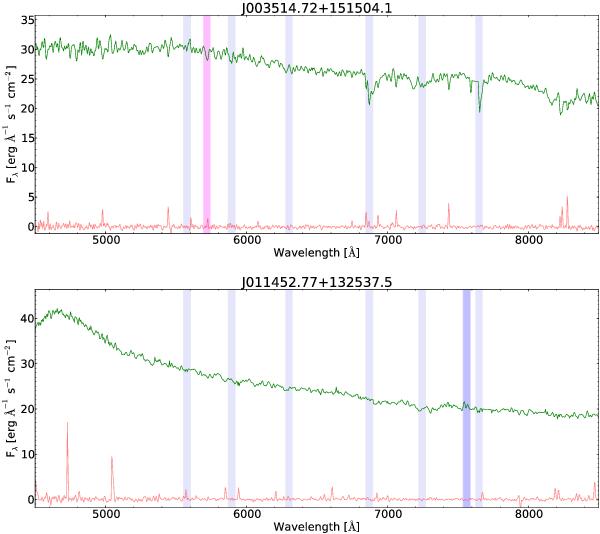
Flux-calibrated spectra. The green lines are the binned (factor of 2) spectra with the red lines representing the typical error (obtained by IRAF - routines) of the respective data point. Features stemming from an imperfect sky-subtraction are marked in light gray, significant (5σ in all 3 spectra or 10σ in 2/3 spectra) absorption/emission features originating in the object are marked light magenta/blue.
Current usage metrics show cumulative count of Article Views (full-text article views including HTML views, PDF and ePub downloads, according to the available data) and Abstracts Views on Vision4Press platform.
Data correspond to usage on the plateform after 2015. The current usage metrics is available 48-96 hours after online publication and is updated daily on week days.
Initial download of the metrics may take a while.