Fig. 9
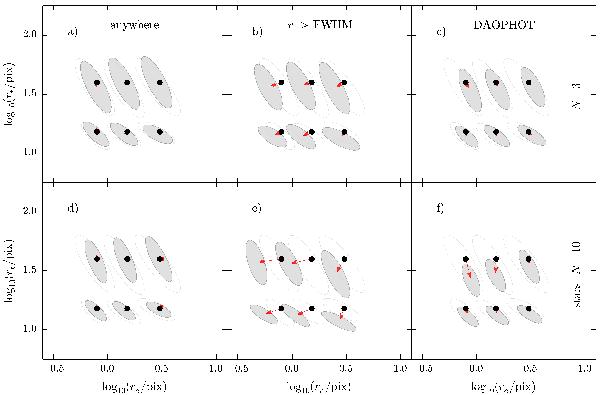
Star subtraction test on 100 Myr and 104 M⊙ King model clusters. 100 models per input parameter node (dot) were computed and 1σ distributions of their recovered parameters are repeated in all panels as open ellipses centered on the nodes. Shaded ellipses indicate distributions of recovered parameters after subtraction of N = 3 (top row) and 10 brightest stars (bottom row) of the cluster. Panels show: a) and d) results without these stars located anywhere in the cluster; b) and e) without these stars beyond cluster’s FWHM, arrows indicate parameter bias; c) and f) the performance of FitClust to iteratively fit model and include the 3 and 10 brightest stars detected freely with DAOPHOT.
Current usage metrics show cumulative count of Article Views (full-text article views including HTML views, PDF and ePub downloads, according to the available data) and Abstracts Views on Vision4Press platform.
Data correspond to usage on the plateform after 2015. The current usage metrics is available 48-96 hours after online publication and is updated daily on week days.
Initial download of the metrics may take a while.