Fig. 2
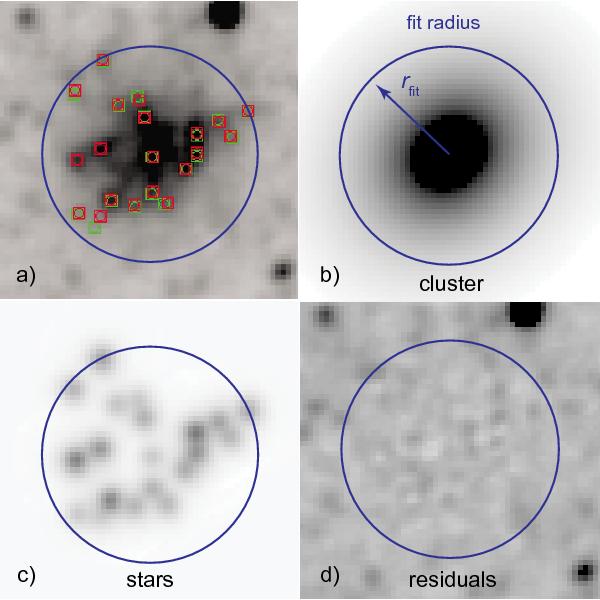
Frame of one of the largest clusters from the M31 sample (Vansevičius et al. 2009) shown in panel a); it is decomposed into cluster model b), stars c), and residual frame d). In panel a) coordinates of stars detected in the first iteration are shown in green, the final iteration in red.
Current usage metrics show cumulative count of Article Views (full-text article views including HTML views, PDF and ePub downloads, according to the available data) and Abstracts Views on Vision4Press platform.
Data correspond to usage on the plateform after 2015. The current usage metrics is available 48-96 hours after online publication and is updated daily on week days.
Initial download of the metrics may take a while.