Fig. 2
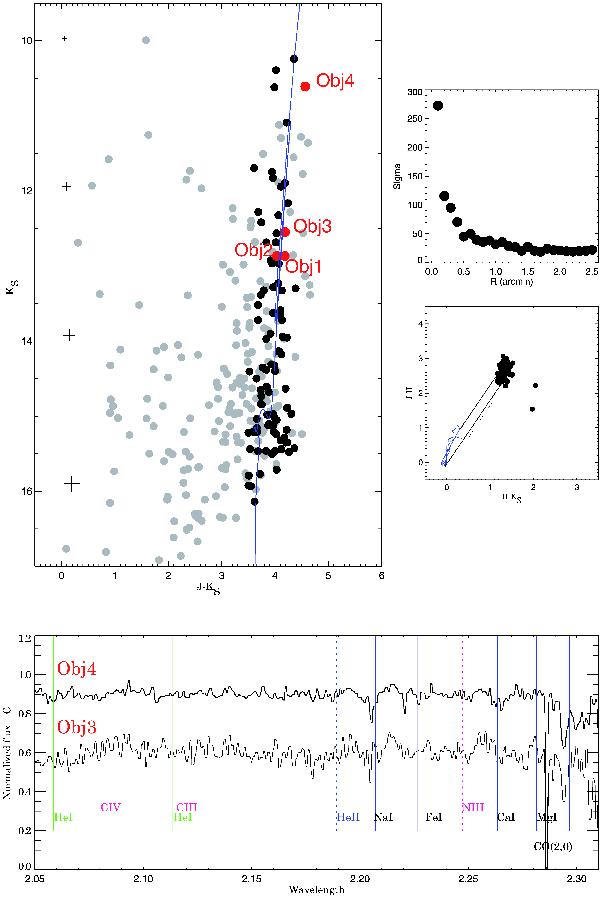
Top left: (J − KS) vs. KS color–magnitude diagram for CL 111. Gray circles are all stars within the estimated cluster radius, dark circles are probable cluster members that remained after statistical decontamination. Stars with spectra are denoted by red circles and are labeled. The best fit is 1.6 Gyr (z = 0.050) Padova isochrone (Bressan et al. 2012). The crosses convey the representative errors in a magnitude bin of 2 KS mag. Top right: The stellar surface density σ (stars per square arcmin) versus radius (arcmin) of all stars in the cluster area. Bottom left: SofI low resolution spectra of Obj 3 and Obj 4. Bottom right: color–color diagram of the most probable cluster members. The locus of Class III and V stars are conveyed as solid lines and are taken from Stead & Hoare (2011, 2MASS system).
Current usage metrics show cumulative count of Article Views (full-text article views including HTML views, PDF and ePub downloads, according to the available data) and Abstracts Views on Vision4Press platform.
Data correspond to usage on the plateform after 2015. The current usage metrics is available 48-96 hours after online publication and is updated daily on week days.
Initial download of the metrics may take a while.