Fig. 10
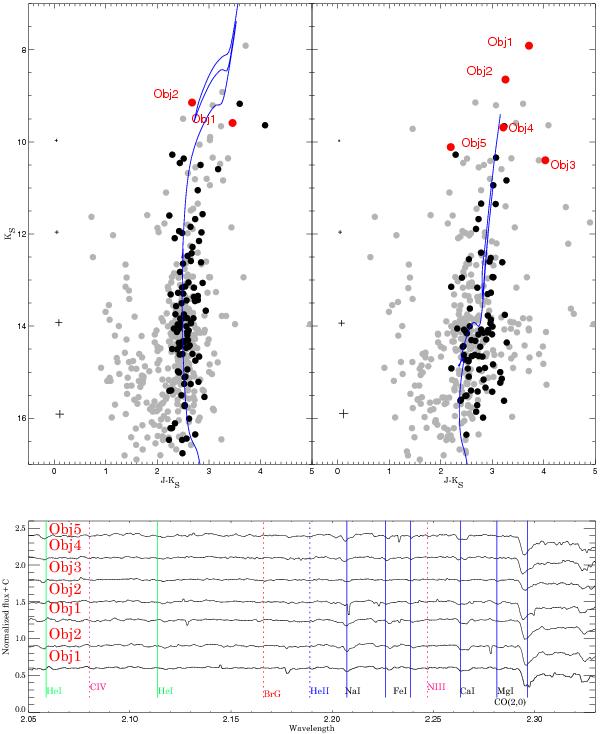
Top: (J − KS) vs. KS color–magnitude diagram for CL 139 (left) and CL 140 (right). The symbols are the same as in Fig. 2. The best fits are 80 Myr and 1.3 Gyr Padova isochrones (Bressan et al. 2012), respectively. Those isochrones are tied to z = 0.012 and z = 0.008 abundances, accordingly. Bottom: SofI low resolution spectra of Obj 1 and Obj 2 of CL 139 and Obj 1, Obj 2, Obj 3, Obj 4 and Obj 5, of CL 140.
Current usage metrics show cumulative count of Article Views (full-text article views including HTML views, PDF and ePub downloads, according to the available data) and Abstracts Views on Vision4Press platform.
Data correspond to usage on the plateform after 2015. The current usage metrics is available 48-96 hours after online publication and is updated daily on week days.
Initial download of the metrics may take a while.