Fig. 3
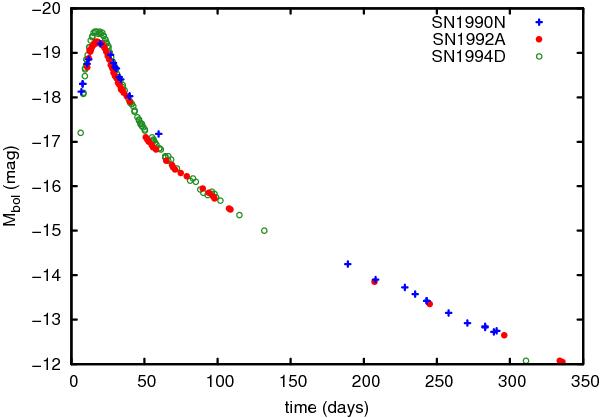
Observed absolute V light curves of three SNe Ia (SN 1990N, SN 1994D, and SN 1992A – Kirshner et al. 1993). Characteristic features of the curves are the steep increase before maximum light (at about 18 days after explosion), the steep decrease until about 50 days after explosion, and the slower decrease later on.
Current usage metrics show cumulative count of Article Views (full-text article views including HTML views, PDF and ePub downloads, according to the available data) and Abstracts Views on Vision4Press platform.
Data correspond to usage on the plateform after 2015. The current usage metrics is available 48-96 hours after online publication and is updated daily on week days.
Initial download of the metrics may take a while.