Fig. 17
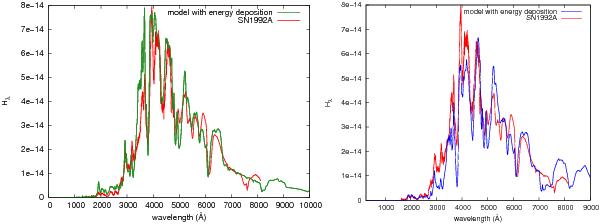
Synthetic spectra for consistent ALImI-models calculated with energy deposition compared with the spectrum of SN 1992A (red line). The spectrum on the right-hand side belongs to a model where the energy deposited in the ionization rates has been reduced by 50% compared with the model whose spectrum is shown on the left-hand side, to show the influence of this energy component on the observed spectral features. Clearly, the difference to the observation in the blue part of the spectrum (shortward of 3500 Å) is strongly diminished in this case.
Current usage metrics show cumulative count of Article Views (full-text article views including HTML views, PDF and ePub downloads, according to the available data) and Abstracts Views on Vision4Press platform.
Data correspond to usage on the plateform after 2015. The current usage metrics is available 48-96 hours after online publication and is updated daily on week days.
Initial download of the metrics may take a while.