Fig. 14
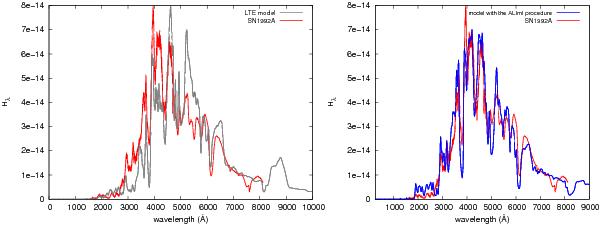
Synthetic spectrum of a consistent ALImI-model (right-hand side) and an LTE-model (left-hand side) used as a starting configuration for the primary iteration cycle, both compared with the spectrum of SN 1992A at early epochs (red line, see also Fig. 12). As is the case for the pure scattering model, both models preserve the total luminosity induced at the inner boundary. The shape of the spectrum resulting from the consistent ALImI-model reveals however a significant improvement when compared with the pure scattering model (Fig. 13) and the observations (especially in the blue part of the spectrum – shortward of 5000 Å – the differences to the observation are strongly diminished in the case of the ALImI-model). An improvement of the calculated spectral characteristics is also seen for the LTE-model, revealing that Bνr(T(r)) presents good starting values for the total line source functions SL(r). The strong discrepancies of individual line shapes especially between 3000 Å and 6000 Å, however, shows that simulations intended for diagnostic purposes should not be based on LTE-models.
Current usage metrics show cumulative count of Article Views (full-text article views including HTML views, PDF and ePub downloads, according to the available data) and Abstracts Views on Vision4Press platform.
Data correspond to usage on the plateform after 2015. The current usage metrics is available 48-96 hours after online publication and is updated daily on week days.
Initial download of the metrics may take a while.