Fig. 10
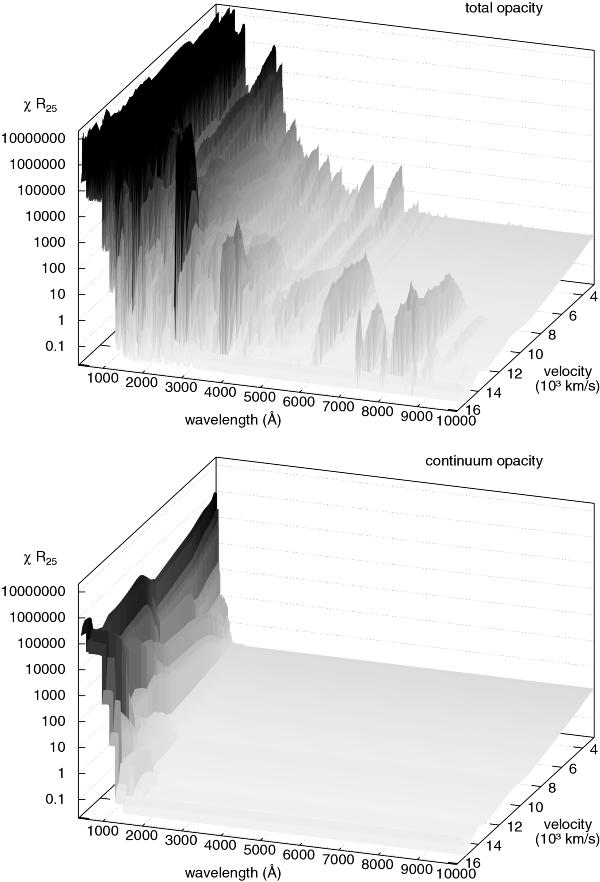
Logarithm of the total opacity (upper diagram) and the true continuum plus Thomson scattering opacity (lower diagram) times the radius R25 (defined for a velocity of v = 3500 km s-1 and a time at day 25) versus velocity and wavelength for a SN Ia model at early phases. Because of the small absolute densities (compared to stars) and a composition which is dominated by low ionization stages of intermediate-mass and iron-group elements, a weak free-free and bound-free continuum is obtained in the optical and infrared part of the spectrum. Therefore, electron scattering opacity becomes the dominating source of opacity at wavelengths redward of about 5000 Å, even for deeper layers of the envelope, whereas the total continuum opacity is completely irrelevant when compared to the line opacity blueward of about 4000 Å. This behavior illustrates the formation of the “pseudo-continuum” in the envelopes of SN Ia, which just results from the overlap of the thousands of spectral lines shown.
Current usage metrics show cumulative count of Article Views (full-text article views including HTML views, PDF and ePub downloads, according to the available data) and Abstracts Views on Vision4Press platform.
Data correspond to usage on the plateform after 2015. The current usage metrics is available 48-96 hours after online publication and is updated daily on week days.
Initial download of the metrics may take a while.