Fig. 7
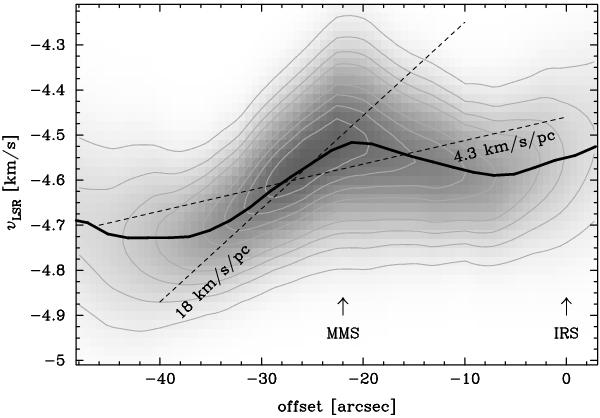
Position-velocity diagram for N2H+(1–0) along the cut marked in Figs. 6b,c from south-east to north-west. The solid line marks the fitted velocity to highlight the shape of the curve. Contours are plotted in steps of 10% of the peak emission. The two dashed lines indicate (a) the velocity gradient attributed to solid body rotation of the core (with a measured slope of 4.3 km s-1 pc-1); and (b) the CAD12 N2D+(3−2) gradient of 18 km s-1 pc-1 for comparison. See Sect. 5.2.2 for more details.
Current usage metrics show cumulative count of Article Views (full-text article views including HTML views, PDF and ePub downloads, according to the available data) and Abstracts Views on Vision4Press platform.
Data correspond to usage on the plateform after 2015. The current usage metrics is available 48-96 hours after online publication and is updated daily on week days.
Initial download of the metrics may take a while.