Fig. 6
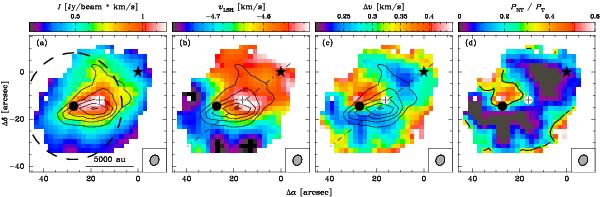
From left to right: N2H+ maps of integrated intensity, velocity centroid, linewidth, and ratio of non-thermal to thermal pressure. Symbols mark the positions of SMM1 (●), MMS (+), and IRS (★). The dashed circle in panel a) represents the FWHM volume density distribution of SMM1. The contours in panels a)–c) represent the N2H+ column density with contours from (1...3) × 1013 cm-2 in steps of 0.5 × 1013 cm-2. In panel d) the contour marks the PNT/PT = 0.3 line. The dash-dotted lines in panels b) and c) mark the cut for the position-velocity diagram, which is shown in Fig. 7. The synthesised beam size is indicated in the bottom right corners.
Current usage metrics show cumulative count of Article Views (full-text article views including HTML views, PDF and ePub downloads, according to the available data) and Abstracts Views on Vision4Press platform.
Data correspond to usage on the plateform after 2015. The current usage metrics is available 48-96 hours after online publication and is updated daily on week days.
Initial download of the metrics may take a while.