Fig. 5
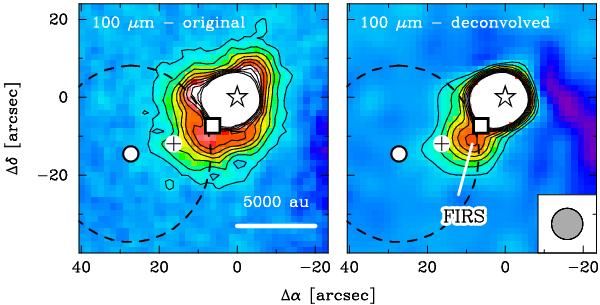
Original (left) and deconvolved (right panel) 100 μm images. The colour scales are exaggerated to highlight the presence of the faint emission feature FIRS. The symbols mark the positions of SMM1 (●), IRS (★), SMM2 (■), and the FHSC candidate MMS (+). The dashed line marks the FWHM of the SMM1 volume density distribution. In both images, the contours are plotted in steps of 3σ above the level of the background cloud. (This noise does not necessarily represent the true noise level around the protostar.) The beam size of the 100 μm observations is indicated in the bottom right corner.
Current usage metrics show cumulative count of Article Views (full-text article views including HTML views, PDF and ePub downloads, according to the available data) and Abstracts Views on Vision4Press platform.
Data correspond to usage on the plateform after 2015. The current usage metrics is available 48-96 hours after online publication and is updated daily on week days.
Initial download of the metrics may take a while.