Fig. 4
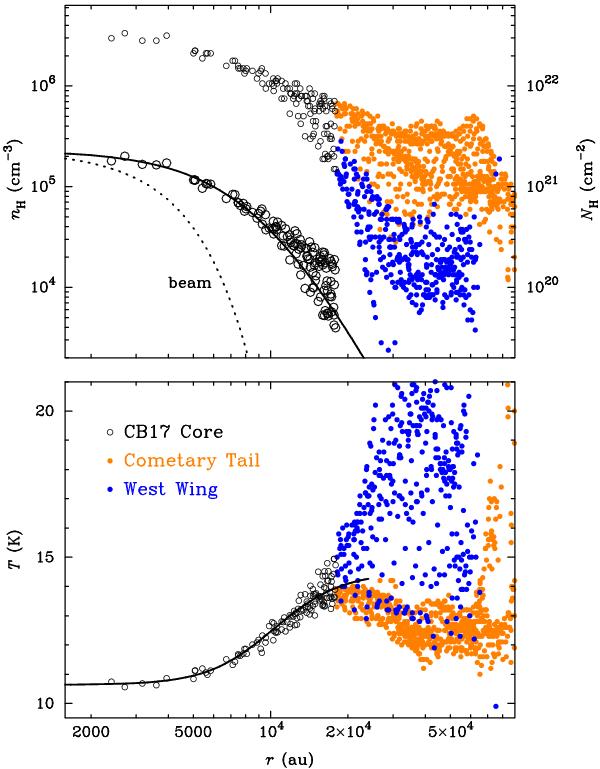
Azimuthally averaged column density (top, small symbols), volume density (top, large symbols), and temperature (bottom) distributions. The data for the cometary tail and the west wing are taken from the MBB, whereas the data for the core is the result of the RT fit (Sect. 3.2). The pixels within a beam size from the Class I protostar IRS are excluded. The solid line shows the curves for the best-fit model (Table 1), the dotted line indicates the beam size.
Current usage metrics show cumulative count of Article Views (full-text article views including HTML views, PDF and ePub downloads, according to the available data) and Abstracts Views on Vision4Press platform.
Data correspond to usage on the plateform after 2015. The current usage metrics is available 48-96 hours after online publication and is updated daily on week days.
Initial download of the metrics may take a while.