Fig. 3
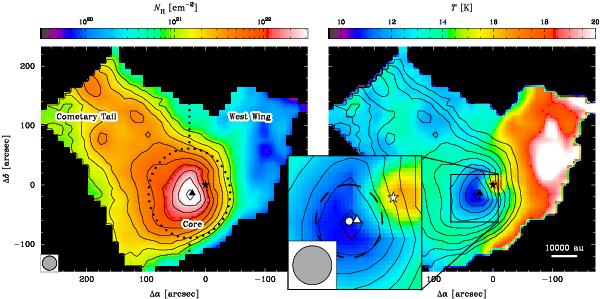
Hydrogen column density (left panel) and dust temperature maps (right panel) of CB 17. The dotted lines mark the boundaries between the three regions discussed in the text (core, cometary tail, west wing). The data for the cometary tail and west wing are fitted by using the MBB algorithm, whereas the core is fitted using the RT-procedure (Sect. 3.2). The temperature in the core represents the mid-plane temperature (i.e., the minimum temperature along the line-of-sight), whereas in the other two regions the LoS-averaged dust temperature is displayed. Symbols mark the positions of SMM1 (▴) and IRS (★) from Launhardt et al. (2010). The inset shows a zoom towards the cold and dense regions. The newly derived postition of SMM1 and the FWHM of the volume density distribution are marked with a white circle and dashed line, respectively. The contours in all panels represent the column density, starting from NH = 1021 cm-2, and subsequent levels in steps of 0.2 dex.
Current usage metrics show cumulative count of Article Views (full-text article views including HTML views, PDF and ePub downloads, according to the available data) and Abstracts Views on Vision4Press platform.
Data correspond to usage on the plateform after 2015. The current usage metrics is available 48-96 hours after online publication and is updated daily on week days.
Initial download of the metrics may take a while.