Fig. 2

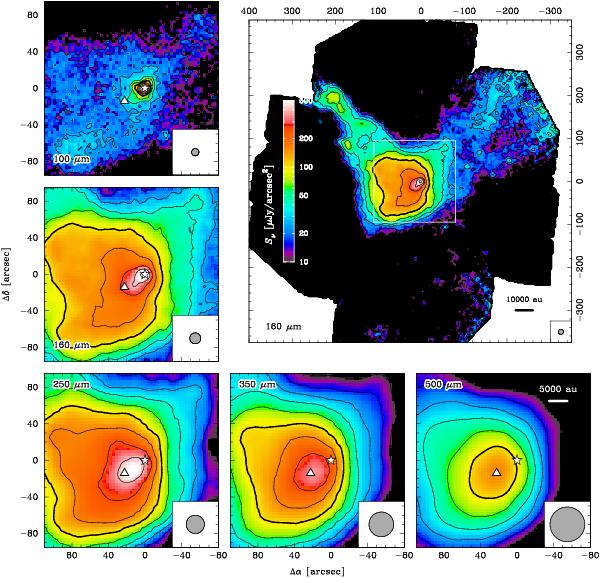
Herschel dust emission maps at 100 μm, 160 μm, 250 μm, 350 μm, and 500 μm. The big panel represents the full field of view at 160 μm, which shows the cometary structure of CB 17. The small panels show detailed views of the white rectangular area for all Herschel observations, ranging from 100 μm to 500 μm. The surface brightness scale is the same for all images. The contours range from 10 μJy / arcsec2 up in logarithmic steps of 0.2 dex. The thick contour represents 100 μJy / arcsec2. The respective beam sizes are depicted in the bottom right corners. Symbols mark the positions of SMM1 (▴) and IRS (★).
Current usage metrics show cumulative count of Article Views (full-text article views including HTML views, PDF and ePub downloads, according to the available data) and Abstracts Views on Vision4Press platform.
Data correspond to usage on the plateform after 2015. The current usage metrics is available 48-96 hours after online publication and is updated daily on week days.
Initial download of the metrics may take a while.


