Fig. 1
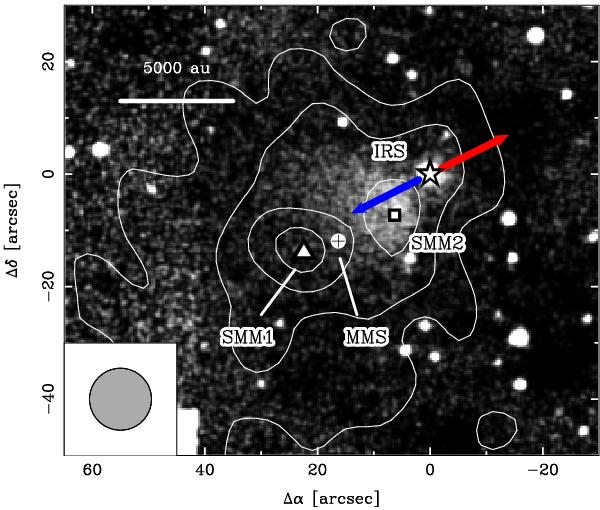
1.2 mm dust continuum emission (contours, plotted in steps of 3σ) overplotted on a NIR
K image
of CB 17 (Launhardt et al. 2010). The arrows
represent the red- and blue-shifted components of the outflow detected by Chen et al. (2012). The grey circle in the bottom
left corner represents the angular resolution of the 1.2 mm dust continuum image. The
coordinate offsets are given w.r.t. to the position of IRS (αJ2000=04h04m33 76,
δJ2000=+56°56′16
76,
δJ2000=+56°56′16 5,
Chen et al. 2012).
5,
Chen et al. 2012).
Current usage metrics show cumulative count of Article Views (full-text article views including HTML views, PDF and ePub downloads, according to the available data) and Abstracts Views on Vision4Press platform.
Data correspond to usage on the plateform after 2015. The current usage metrics is available 48-96 hours after online publication and is updated daily on week days.
Initial download of the metrics may take a while.