Fig. 7
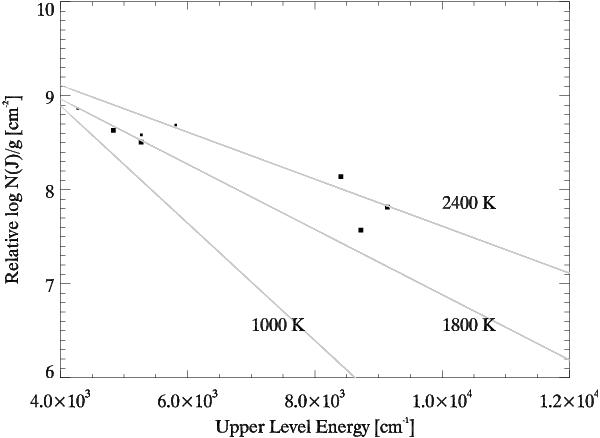
An energy diagram of H2 at 2.25 arcsec to the northeast of the central region. Squares show the measured line intensities and the lines show expected H2 line intensities for a given temperature. The slopes of the lines indicate the temperature of the H2 and shows the modelled energy distributions for 1000 K, 1800 K, and 2400 K, where the vertical scales are arbitrary. The H2 excitation temperature is above 1800 K.
Current usage metrics show cumulative count of Article Views (full-text article views including HTML views, PDF and ePub downloads, according to the available data) and Abstracts Views on Vision4Press platform.
Data correspond to usage on the plateform after 2015. The current usage metrics is available 48-96 hours after online publication and is updated daily on week days.
Initial download of the metrics may take a while.