Fig. 5
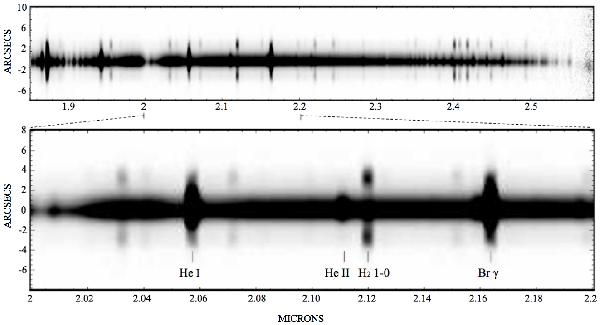
A spatially resolved VLT ISAAC (outflow) spectrum. The spectrum, taken across the minor axis of the main hourglass shell, is shown at high contrast with the most prominent atomic and molecular emission lines visible. Two-micron spectrum (top), 2.25 arcsec from the central region along the nebula’s minor axis, shows a plethora of strong He recombination and H2 vibrational lines. Bottom is an enlarged view of the region of this spectrum over the range 2–2.2 micron. More details of this spectrum are shown in Fig. 6
Current usage metrics show cumulative count of Article Views (full-text article views including HTML views, PDF and ePub downloads, according to the available data) and Abstracts Views on Vision4Press platform.
Data correspond to usage on the plateform after 2015. The current usage metrics is available 48-96 hours after online publication and is updated daily on week days.
Initial download of the metrics may take a while.