Fig. 2
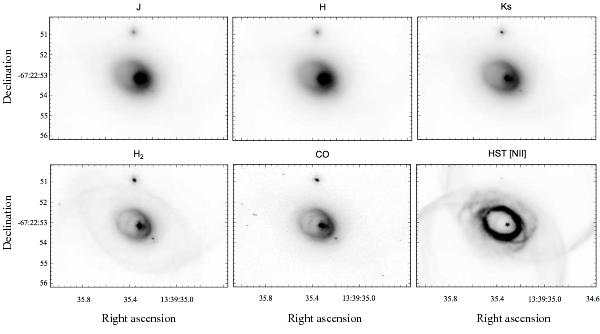
Linear stretches of the images in Fig. 1. The central region of each image is displayed at a higher contrast linear scale to show the features of interest not apparent in Fig. 1. The stretches, in comparison to those images in Fig. 1, are as follows: x10 for J,H,Ks and CO, x4 for H2, and x2 for [N ii]6584 Å.
Current usage metrics show cumulative count of Article Views (full-text article views including HTML views, PDF and ePub downloads, according to the available data) and Abstracts Views on Vision4Press platform.
Data correspond to usage on the plateform after 2015. The current usage metrics is available 48-96 hours after online publication and is updated daily on week days.
Initial download of the metrics may take a while.