Fig. 11
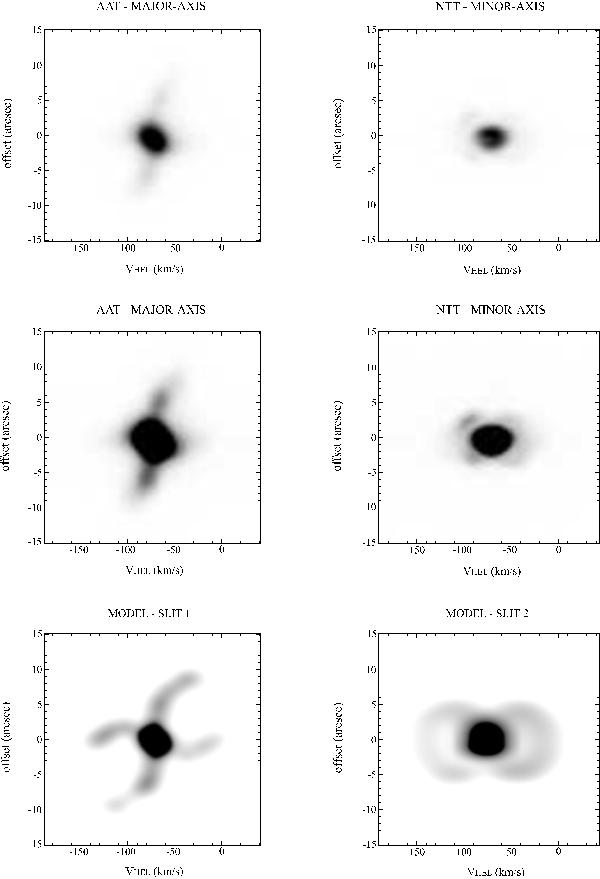
MES, EMMI, and synthetic P-V arrays. The arrays on the left column (labelled AAT) are those for a long-slit applied to the major axis of the nebula using MES, whereas the right column (NTT) shows the arrays for a long-slit placed across the minor axis using EMMI (see Fig. 12b for these slit positions). The P-V arrays on the top panel and those on the central panel are the same, except using different stretches of the intensity scale. Shown at the bottom (MODEL) panel are the corresponding synthetic P-V arrays, which were generated using the SHAPE model.
Current usage metrics show cumulative count of Article Views (full-text article views including HTML views, PDF and ePub downloads, according to the available data) and Abstracts Views on Vision4Press platform.
Data correspond to usage on the plateform after 2015. The current usage metrics is available 48-96 hours after online publication and is updated daily on week days.
Initial download of the metrics may take a while.