Fig. 10
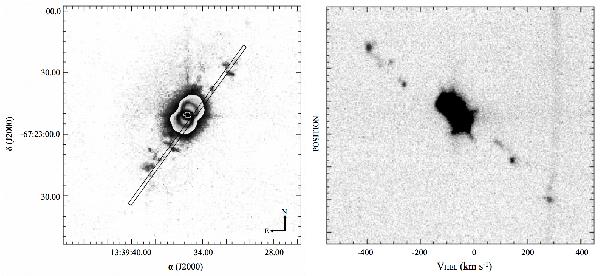
Images of the hypersonic knotty outflow of MyCn 18. Left: a continuum subtracted image of MyCn 18 revealing the relative positions of the high-speed knots. Right: a P-V array for a long-slit placed down the nebula’s major axis and through various knots, located north and south of the nebular lobes. The slit position shown on the left is a rough estimate of that used to produce the P-V array on the right. The knots south of the nebula (and through the slit) in the continuum subtracted image present the knots in the top left of the P-V array, and conversely, the knots north of the nebula present those in the bottom right. Both images in the figure are adopted from O’Connor et al. (2000).
Current usage metrics show cumulative count of Article Views (full-text article views including HTML views, PDF and ePub downloads, according to the available data) and Abstracts Views on Vision4Press platform.
Data correspond to usage on the plateform after 2015. The current usage metrics is available 48-96 hours after online publication and is updated daily on week days.
Initial download of the metrics may take a while.