Fig. 6
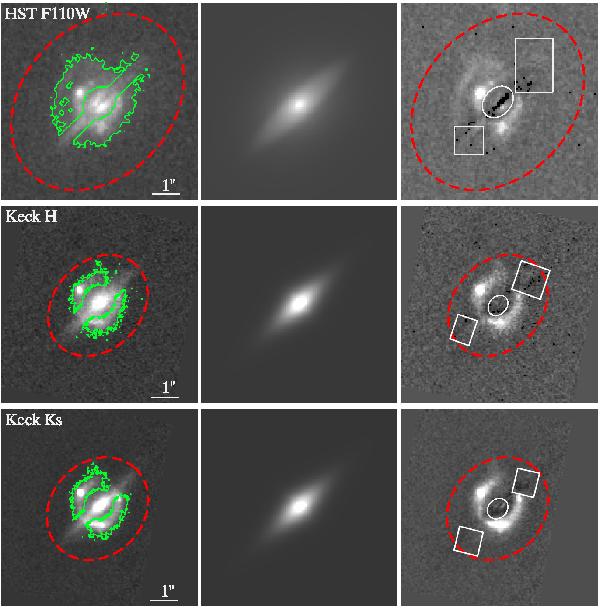
Using galfit to estimate the foreground emission profile. North is up; east is left. Left-hand side panels show original imaging from HST F110W (upper row), Keck-AO H (middle row), and Keck-AO Ks (bottom row). The right-hand side panels show the residuals after foreground emission subtraction using the model in the middle panels. The green contours in the left panels delimit the mask used to indicate pixels masked out in the galfit analysis. The red dashed ellipses encompass the region where the flux was estimated. The extra squared regions on the right panels flag out over-subtracted regions for improved photometry.
Current usage metrics show cumulative count of Article Views (full-text article views including HTML views, PDF and ePub downloads, according to the available data) and Abstracts Views on Vision4Press platform.
Data correspond to usage on the plateform after 2015. The current usage metrics is available 48-96 hours after online publication and is updated daily on week days.
Initial download of the metrics may take a while.