Fig. 5
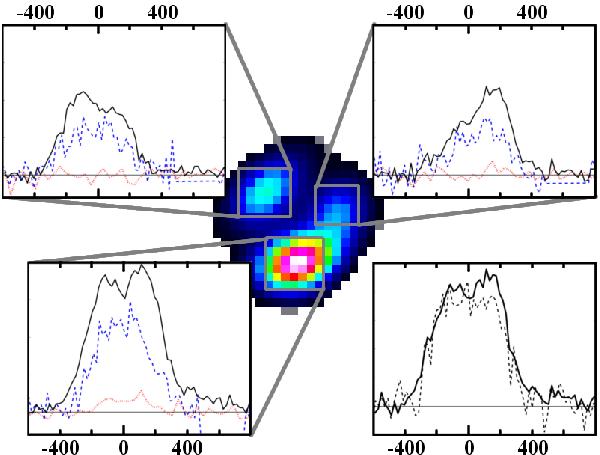
Line profiles of the emission lines detected in H1429−0028 on each of the specified knots A+B, C and D (grey boxes): CO(4 → 3) as solid black line; CS(10 → 9) as a dotted red line (scaled up by a factor of 2); and [CI 3P1→3P0] as dashed blue line (scaled up by a factor of 2). The bottom right panel compares the line profiles of the overall CO(2 → 1) (dashed line, scaled up by a factor of 2.5) and CO(4 → 3) (solid line) emission. Different spectral resolutions are considered (20 km s-1 for CO(2 → 1), CO(4 → 3) and C i, and 40 km s-1 for CS(10 → 9)). The y-axes have the same span in all panels, except the bottom right one. The x-axis range is −600 to 800 km s-1 in all panels. The horizontal solid line indicates the zero-flux level. The background colour image is the CO(4 → 3) moment-0 map from Fig. 4.
Current usage metrics show cumulative count of Article Views (full-text article views including HTML views, PDF and ePub downloads, according to the available data) and Abstracts Views on Vision4Press platform.
Data correspond to usage on the plateform after 2015. The current usage metrics is available 48-96 hours after online publication and is updated daily on week days.
Initial download of the metrics may take a while.