Fig. 4
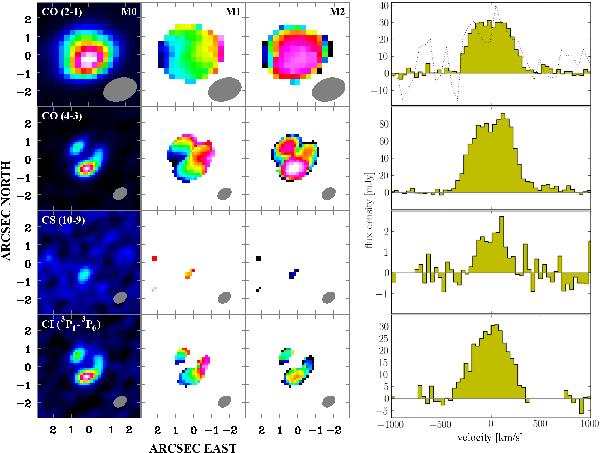
Moment maps and line profiles of the emission lines detected in H1429−0028 as observed by ALMA: CO(2 → 1) on the first (upper) row; CO(4 → 3) on the second row; CS(10 → 9) on the third row; [CI 3P1→3P0] on the fourth row. The columns show different image moments: moment 0 (M0, velocity-integrated flux, left), 1 (M1, velocity map, middle), and 2 (M2, dispersion map, right). Natural weighting was adopted to produce the moments. The beam is shown at the lower right in each panel as a shaded ellipse. Axes units are arcseconds. Colour scales of M0 are from −0.3 to 8 (first row), 18 (second), 2 (third), 5 Jy km s-1 (fourth). Colour scales in M1 and M2 are, respectively, −200 to 200 km s-1 and 0 to 170 km s-1. The right-most column shows the line-profiles at a spectral resolution of 40 km s-1. The first row also shows the CARMA spectrum as a dotted line.
Current usage metrics show cumulative count of Article Views (full-text article views including HTML views, PDF and ePub downloads, according to the available data) and Abstracts Views on Vision4Press platform.
Data correspond to usage on the plateform after 2015. The current usage metrics is available 48-96 hours after online publication and is updated daily on week days.
Initial download of the metrics may take a while.