Fig. 3
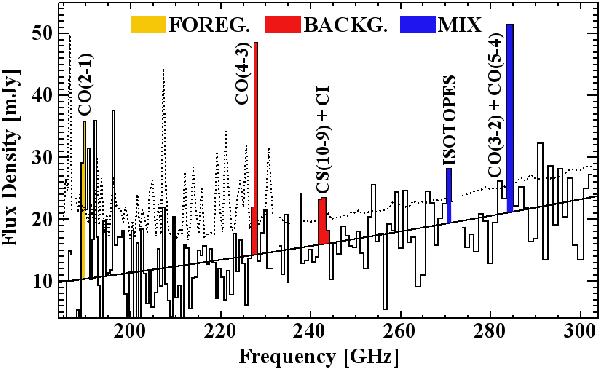
Z-Spec spectrum of H1429-0028 with observed frequency on the x-axis and flux density (mJy) on the y-axis. Reliably detected lines include CO (J:4 → 3) and CO (J:5 → 4) at z = 1.026 ± 0.002. The channel where CO (J:5 → 4) from the background source is observed is likely contaminated by CO (J:3 → 2) from the foreground source. Colours represent channels with line emission from the foreground source (yellow), background source (red), or a mix from both (blue, see text for more details). The solid line shows the fit to the continuum, while the dashed line represents the 1σ error above the continuum.
Current usage metrics show cumulative count of Article Views (full-text article views including HTML views, PDF and ePub downloads, according to the available data) and Abstracts Views on Vision4Press platform.
Data correspond to usage on the plateform after 2015. The current usage metrics is available 48-96 hours after online publication and is updated daily on week days.
Initial download of the metrics may take a while.