Free Access
Fig. 2
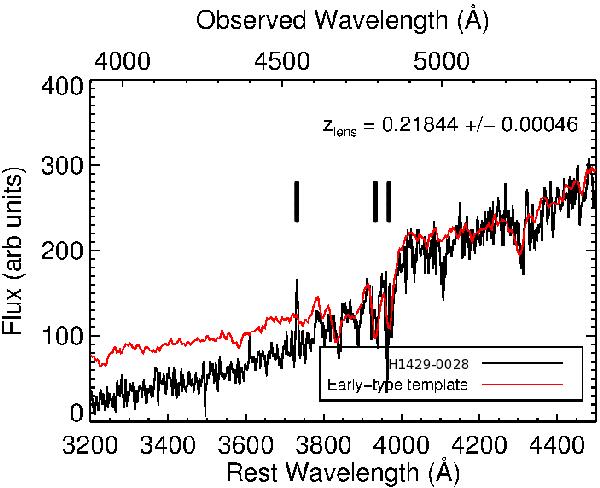
Foreground spectrum observed with GMOS-S at Gemini-South. The black line shows the observed spectrum, while the overlaid red line shows the best-fit early-type template. The three vertical lines indicate the wavelengths of the [O ii] and Ca H and K lines.
Current usage metrics show cumulative count of Article Views (full-text article views including HTML views, PDF and ePub downloads, according to the available data) and Abstracts Views on Vision4Press platform.
Data correspond to usage on the plateform after 2015. The current usage metrics is available 48-96 hours after online publication and is updated daily on week days.
Initial download of the metrics may take a while.