Fig. 11
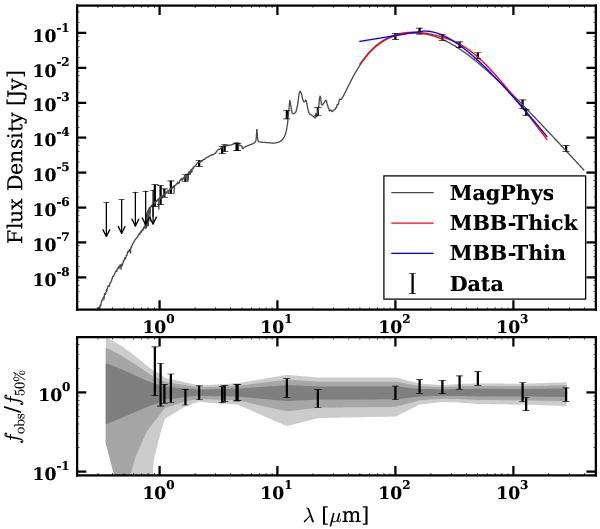
Comparing the input flux data points (errorbars) and the predicted fluxes by magphys (grey regions referring to 1σ, 2σ, and 3σ confidence intervals in the bottom panel). The best fit model from the magphys analysis is shown as a grey solid line. The best-fit models from the modified black body fitting are shown as red (optically-thick case) and blue (optically-thin) solid lines. The bottom panel shows the flux ratios with respect to the 50% quartile of the flux PDF at a given band.
Current usage metrics show cumulative count of Article Views (full-text article views including HTML views, PDF and ePub downloads, according to the available data) and Abstracts Views on Vision4Press platform.
Data correspond to usage on the plateform after 2015. The current usage metrics is available 48-96 hours after online publication and is updated daily on week days.
Initial download of the metrics may take a while.